PM trade ideas

PHILIP MORRIS prediction till 2023 year by Powerful TradersHello everyone!
Traders, we do not like to write more.
The prediction of the PING AN' price you can find on a chart!
Regards, Team Traders "Powerful Traders"

Powerful Traders, everyday EWA's analysing & working processPHILIP MORRIS detailing complex Correction with ''WXY''.
Regards, Team Traders "PowerfulTraders" flat

Hard habit to breakFor the last few months, when you were out doing your grocery shopping and donning the face masks, did you notice how the smokers slow down and try to take a puff while adjusting their face mask uncomfortably?
You see, we are all creatures of habits. And I don't want to sound like a broken record, educating why smoking is bad for health, blah blah blah.......
I was an ex-smoker so I fully understand how hard it was to quit .......anyway, that for another story.
You will be surprised that people smoke for many illogical reasons like :
I have nothing better to do
when I smoke, I get more creative
It helps me to destress
I sleep better at nite
So, I aint going to judge whatever the reasons the smokers smoke.
Chart wise, it looks great with a strong support at 67.16. If it breaks out from the bullish trend line (dotted), we can then expect it to rise to 72 level before going higher.

PM LongFalling Wedge + RSI Divergence + PivotPoint Rejection + Loss of Bearish Momentum
I'll be looking for price action to give rejections of the PivotPoint at 67.95 and the break of the Falling Wedge before entering Long.

Philip Morris go down!Philip Morris is currently working on a double top, I assume that the completion of the figure will occur at $ 66 level, and there I am going to buy it!


Cigarettes turning red Phillip Morris double top rejected 61.8% and support turned resistance level.

My Analysis On Philip Morriss Corp StockMy Analysis On Philip Morriss Corp Stock there is two scenarios exceed the up blue line and go up or hit the line and back down to the line below


$PM - long, earnings 2/6 before openNYSE:PM - long, speculative play, get out before the 2/6 Earnings before market open


PM Earnings play2.31 cost of spread 77.5/85
Earnings play as vaping is moving into a recession due to fears and cigarette sales may be higher.
It also bounced after Altria deal fell through.
Max gain will be 25% of the spread which is a sale price of $3.60
Max gain is $130.
Max loss is $130

Phillip Morris LongSome news on an Altari (MO) merger due to poor results, - PM has hit support 5 times and bounced off, I will follow my ta and stop loss in profit , 3 quarters would be a nice holding period for this, but I may close this as soon as we get to some profit.

PM, Philip Morris International Inc.- Head & ShouldersNYSE:PM
Do you know this pattern? The so-called head and shoulders in the analysis of financial markets is an opportunity to be taken if you trade. Do you know why? It's all about math and probability. Staying on the statistical side in your favor is what creates potential financial growth, which in turn will give you time to do what you like.


Daily PM stock price trend forecasts analysis 15-JUL
Investing position: In Rising section of high profit & low risk
S&D strength Trend: In the midst of an adjustment trend of downward direction box pattern price flow marked by limited rises and downward fluctuations.
Today's S&D strength Flow: Supply-Demand(S&D) strength flow appropriate to the current trend.
read more: www.pretiming.com
Forecast D+1 Candlestick Color : RED Candlestick
%D+1 Range forecast: 0.3% (HIGH) ~ -1.6% (LOW), -0.6% (CLOSE)
%AVG in case of rising: 1.4% (HIGH) ~ -0.6% (LOW), 1.1% (CLOSE)
%AVG in case of falling: 0.4% (HIGH) ~ -1.3% (LOW), -0.7% (CLOSE)
Philip Morris sell signalsPhilip Morris (PM), Daily chart: Resistance line + Bearish Engulfing candles pattern + Side of Bollinger bands (20,2) + Hidden divergence on RSI(14)

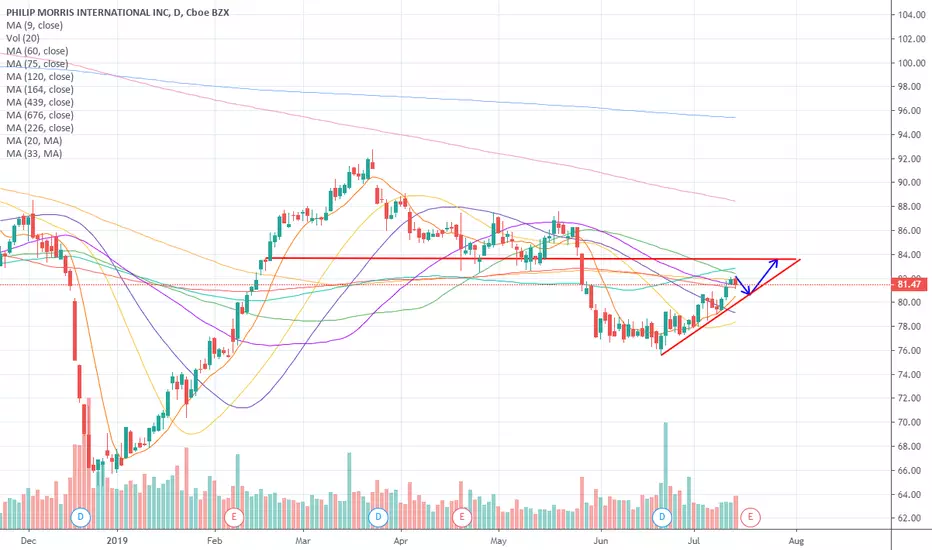
idklooks like consolidation for another drop down, but macd is crossing and the double MA is about to, this might end up being a big U and turn around to the bull side

