PM STOCK POSSIBLE BOUNCE AT 100 LEVEL-LONGPM - PHILLIPS MORRIS IS RIGHT NOW IN A DOWN TREND; HOWEVER, PM STOCKS MIGHT FIND SUPPORT AT LEVEL OF 100, WHICH HAPPEN TO BE THE 61.8% OF THE BC WAVE.
THE TARGET IS FIRST THE 50% (107.96) FIBONACCI RETRACEMENT AND SECOND THE 61.8% LEVEL (109.82).
IF PM BREAKS THE 100 LEVEL DOWN FOR A GOOD MARGIN, THE LONG CONDITION IS CANCELLED
GOOD LUCK!!!!!
PM trade ideas


PM Mid Term view. Long BiasThe bullish trend started this year with new ATH should continue with the slope of the 100 ma weekly, which is not so fast but offers good r/r during retests of the moving average and overshootings to the high. I do not mention fundamentals.

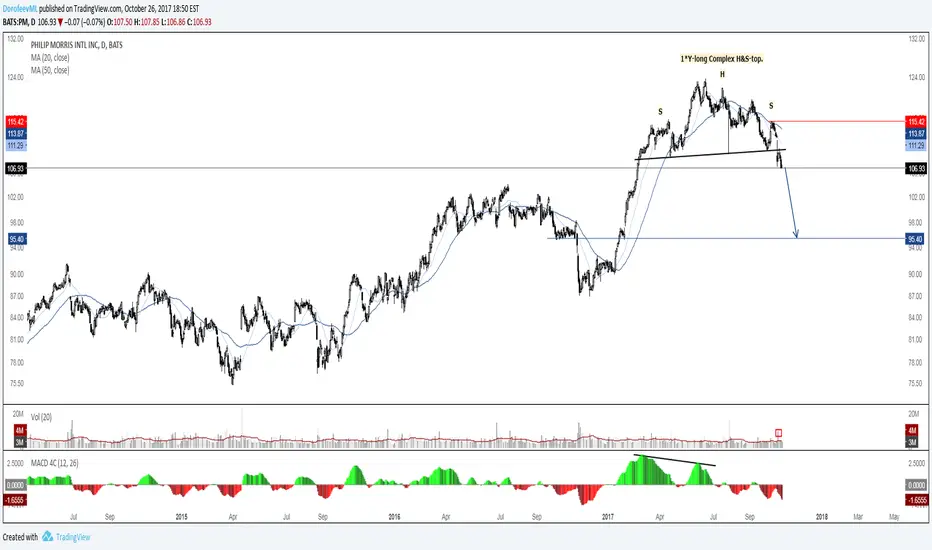


SELL- DOUBLE TOPThis pattern is found at the peaks of an upward trend and is a clear signal that the preceding upward trend is weakening and that buyers are losing interest.


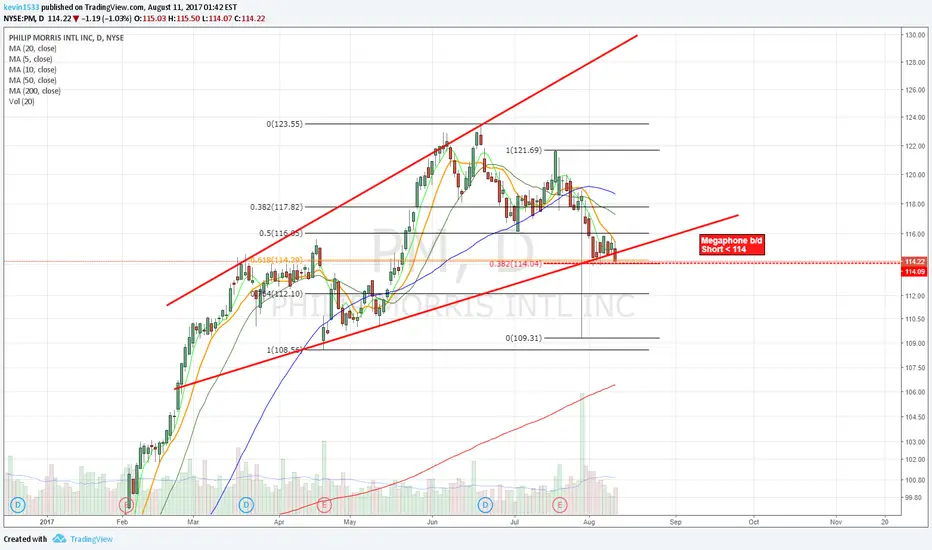
Philip Morris extremely overboughtPhilip Morris ($PM) is showing some great short entry signals:
M bollinger bandpattern on decreasing RSI.
Second, slightly lower peak with decreasing volume.
Bearish engulfing candle with almost no lower wick means no buying pressure at the close.
Personal Strategy:
Given the bearish engulfing pattern, an immediate entry is acceptable.
Take some profits of table when price hits $110. If price breaks the $110 resistance, and continues down through the $109.35 mark, hold through to the $104.12 resistance.
If price does not continue down through either $110 or $109.35, exit entire position.

PHILIP MORRIS NYSE SHORTSome indications are highlighted in the analysis. The conclusion is to SELL.


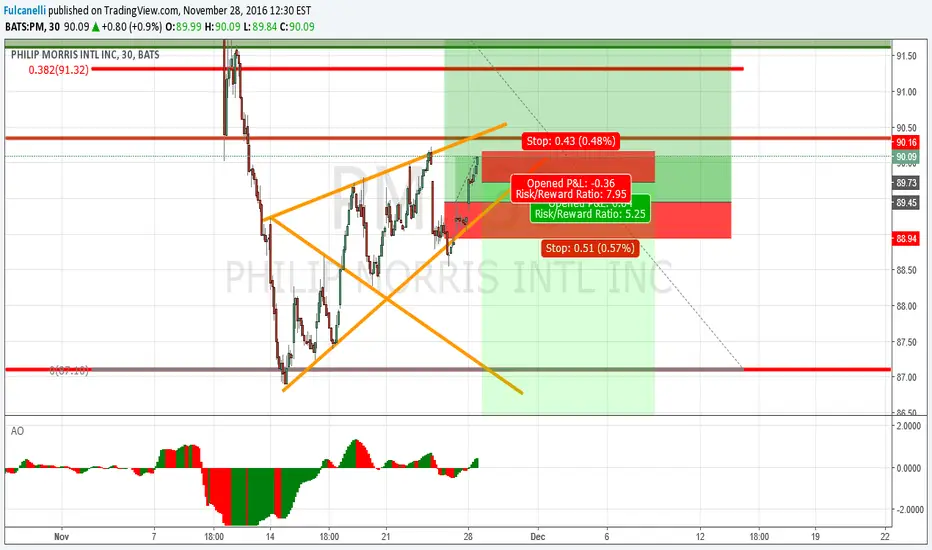
philip morrisPM (philip morris) seems to be in a down trend. the current 93 area, seems to be a resistance area. a break above this area will target the 96 area, but my bias here is on the short side. I believe this may be a good r/r point to enter a short trade with a possible target of 88 area.