QCOM trade ideas

QCOM - earnings300723
- if it stays above TL, we go for the upper edge of the channel
- the potential is 141
- I will consider buying a call option 🧐

Triple Bottom BreakoutLooking at some upside on NASDAQ:QCOM after it's completed a triple bottom pattern.
If it breaks out, looking for a target of $180
The stock has an additional bonus - sporting a ~2.5% dividend.

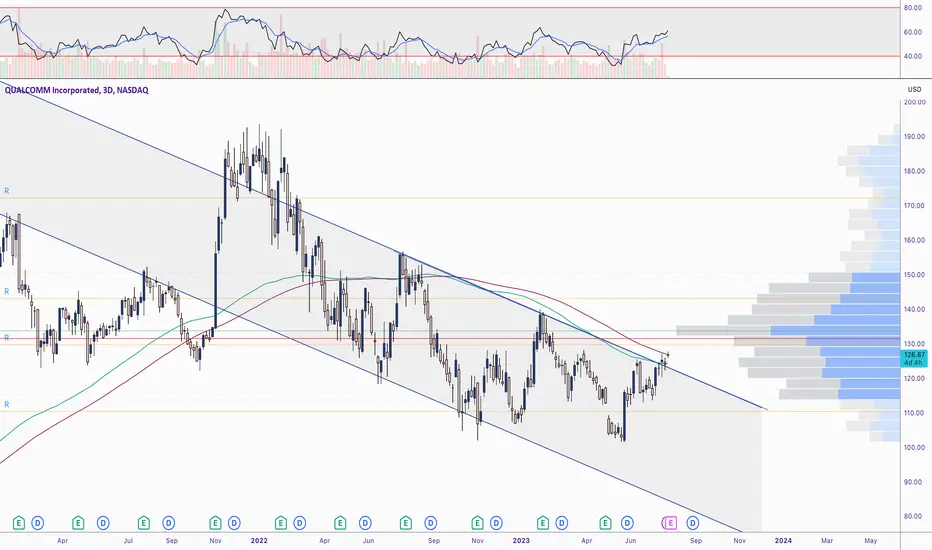
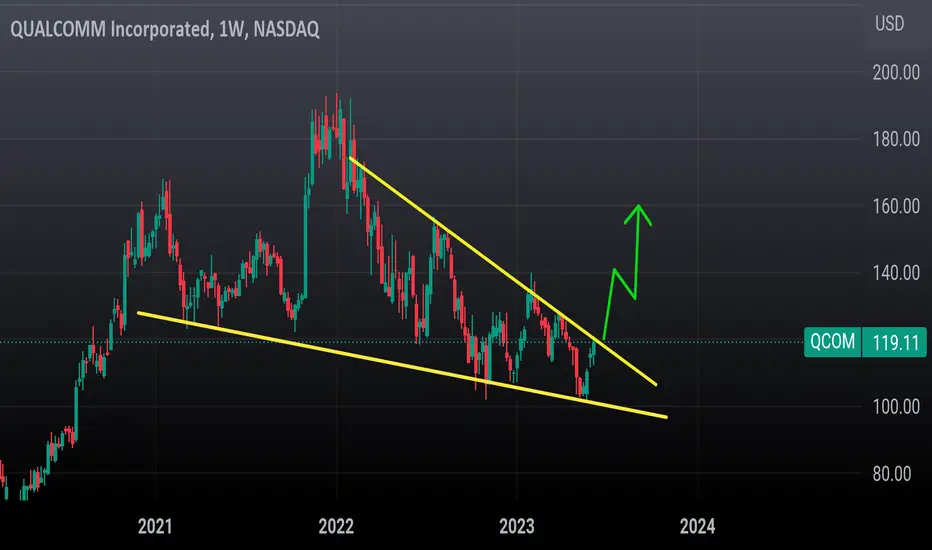
QCOM 2H 2023 3D chartKeeping an eye on QCOM as it tries to break out of its multi-year down channel.
Keeping an eye on that 131 area, but considering past-earnings and the hype on semis, this could follow closely with INTC, if the market continues to avoid selling off.
Qualcomm $QCOM | Bullish Falling Wedge BreakoutNASDAQ:QCOM continues pushing to the upside since breaking out of a bullish falling wedge pattern (RSI divergence confirmation).
The current bullish wave has developed within a flag structure setting higher highs and higher lows.
Pay attention to how price reacts at the upper resistance of the flag.
1) If price manages to breakout above the upper resistance of the flag I expect it to continue to ~$132.
2) If, however, price cannot manage to break above the flag resistance we may see price test the ~$105-$110 area which will provide an alternative buying opportunity.
I will update as price action develops further.

QCOM, a long journey aheadDeep watch QCOM.
A breakout pivot point (many resistence here: key level, neckline, trendlines, etc)
If QCOM overcomes this successfully, QCOM will be a potential stocks in the future.
Wait and see!

Qualcomm bullish pattern - inverse head and shouldersNo clear breakout yet but is is easy to draw a clear inverse head and shoulders pattern on the chart of chipmaker Qualcomm. I will look out for this one.

QCOMHere's one just for fun, huge long term patterns playing off one another, can it really be... it'll be alot of fun watching this that's for sure

QCOM - Falling Trend Channel🔹Breakout resistance at 123 in inverse head and shoulders formation.
🔹Tests resistance at 126, potential NEGATIVE reaction; upward breakthrough signals POSITIVE.
🔹Technically NEUTRAL for the medium long term.
Chart Pattern;
🔹DT - Double Top | BEARISH | 🔴
🔹DB - Double Bottom | BULLISH | 🟢
🔹HNS - Head & Shoulder | BEARISH | 🔴
🔹REC - Rectangle | 🔵
🔹iHNS - inverse head & Shoulder | BULLISH | 🟢
Verify it first and believe later.
WavePoint ❤️

Use 130c expire 08/18 to trade its next ERaccording to TipRanks, the average price target for Qualcomm Inc is $135.26. This is based on 20 Wall Streets Analysts 12-month price targets, issued in the past 3 months. The highest analyst price target is $152.00 ,the lowest forecast is $110.00. The average price target represents 15.11% Increase from the current price of $117.5

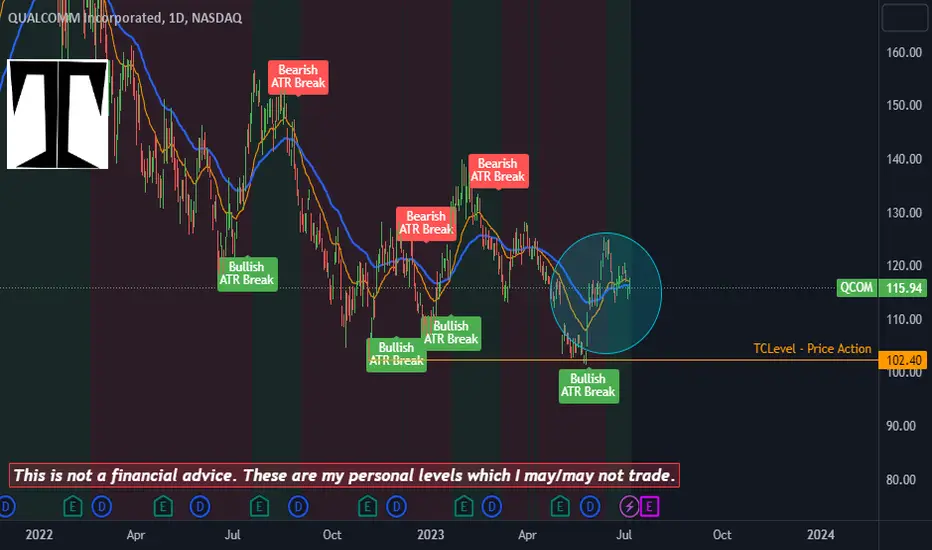
Bullish Alert : QCOMDaily Chart
Bullish Alert after a double bottom with bullish crossover.
The price action is not well defined.
QCOM 2-1 daily setupQCOM has nice magnitude to the upside with a price target being Tuesday's high. A strong volume push beyond that would change my price target to the s/r flip zone above. There is downside opportunity here too, but it has a more shallow price target, with more downside potential to the lower s/r flip zone.

QCOM Prediction using Fixed Range Vol w/ S&RSo - I've been playing a new tool (to me it is), the 'Fixed Range Vol' I only recently realized is available in TradingView's arsenal.
I'm not exactly sure if I am using the correct way that it's intended to be used but so far, it's been a pretty reliable tool for my chart analysis attempts.
1.) I start by selecting the HH's and LL's on a higher time chart, let's say for example either the D or 4H and then again on a smaller time frame, let's say 4H or 1H and then again on the same or similar time frame as the last except this time I'd select points that are relevant to the symbols last noticeable trend movement.
2.) Then I would correlate the outcomes from those Fixed Range results withthe Supply & Demand areas generated from the indicator 'FluedTrades-SMC Lite' .
More times than not - there is a fairly clear pattern or indication as to what the chart's next movements might be. So far - I've actually been quite surprised with the number of times this unusual method I somehow started using has been correct.
Or is this a commonly used strategy that I just don't/didn't know of?

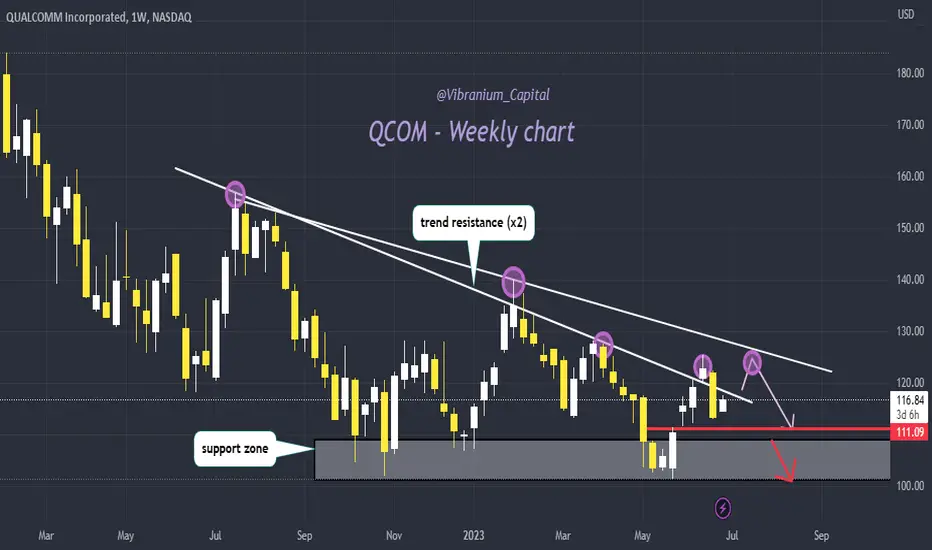
multiple trend resistances lines holding it back! 🐻QCOM unable to break that trend resistance for a while now, even if it rallies a bit I wouldn't long
I expect 100 or lower in next few months or so.. boost and follow for more! thanks ❤
Qualcomm (QCOM) | Two Technical Scenarios, How To Get It!Hi,
I have a few requests about Qualcomm (QCOM) and I would like to some technical scenarios, how to get it.
Qualcomm develops and licenses wireless technology and designs chips for smartphones. The company's key patents revolve around CDMA and OFDMA technologies, which are standards in wireless communications that are the backbone of all 3G, 4G, and 5G networks.
The firm is also the world's largest wireless chip vendor, supplying nearly every premier handset maker with leading-edge processors. Qualcomm also sells RF-front-end modules into smartphones, as well as chips into automotive and Internet of Things markets.
Let's start with the first one and it is so-called buy the strength. Currently, it trades between $120 to $130 and there is quite a strong horizontal level to fight with. So to buy it at the current prices would technically be a mistake. As I have said if you don't want to buy it from the bottom or if you don't want to buy the weakness then you have to wait for a confirmation.
QCOM gets its confirmation after it has made a new mid-term higher high (HH). It will give the confidence that investors are interested more than before. The new mid-term higher high gets confirmed after weekly trading closes above $140 (blue line). After that, we have a break above the strong horizontal price zone, new HH, and wait for a retest to occur to get in a bit better prices.
The second scenario is to buy it after it gets a downward rejection from the current price. It is possible because $120 to $130 has been historically a really strong price level and rejection of new lows isn't utopic.
To prepare for a new decline we have to find the strongest price zone below and technically the strongest price zone stays just below $100, okay let's include the $100 there as well :)
The criteria are:
1. The round number, the psychological number $100.
2. 50% drop from the all-time high. Well-known stocks often find support around this criterion and currently, it stays at $97-$98.
3. The most powerful criterion is the old resistance levels become support levels. Basically at the end of 2020, when the breakout and the rally to all-time highs started, it has not retested the breakout area yet. So we have quite a good amount of liquidity there to wait for. These untested areas, combined with other criteria to support it, can play out with a high percentage of the time. Hopefully, this time is not an exception ;)
Summary:
Technically there are two options:
- Wait for a break above $140, to get a confirmed move and wait for a retest around $130.
- If the current "rally" doesn't break the strong horizontal level then wait for lower levels from where we might get that needed liquidity and it stays around $75 to $100.
Do your own research and if that matches with mine then you are ready to go.
Thank you,
Vaido

QCOM nearing breakoutQCOM on weekly candle nearing breakout. Right now it is reached resistance zone which was earlier support. Support take around 100 and bounced back. Once this resistance breaks it will shoot towards North. Keep watch on it. AI will give boost to chip market.

Qcom another leg up after breaking multiple resistance linesQCOM looking for a small correction and potential bull flag after breaking a multi week line as well as one from last july. This is a potential call setup 45-60 days out with a strike within 20$ of current price

QCOM Expecting QCOM to continue much higher in the coming months. Basic breakout continuation play. Lagging behind the rest of it's sector and ready to pop.

QCOM LongJust a decent risk/reward trade here on QCOM. Good company that will be around for a long time. I'm going to give it a shot.

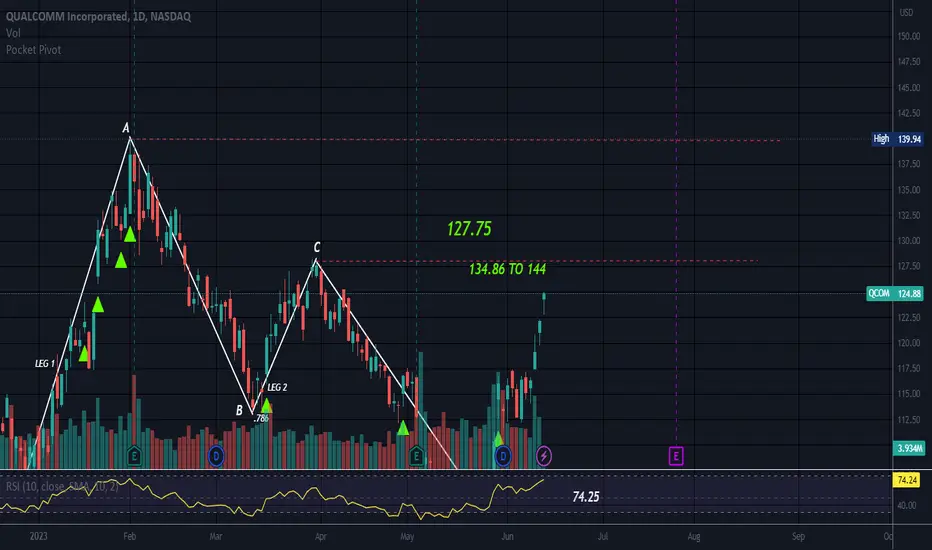
M PatternM patterns are known to reverse at the end of the 4th leg.
This one landed between the 1.113 and the 1.272. Rarely do Harmonic patterns hit a Fib level right on the dot.
Leg 2 hit the .786 on the pullback which points to a Butterfly pattern. The Butterfly ends at the 1.272 and price did not quite make it to the 1.272.
An Alternate Bat ends at the 1.113, but it's rules do not allow leg 2 to reach the .786.
So choose (:
Overbought with RSI on 70. Not overbought with RSI on 80.
Qcom.. Next to run?Closed up at weekly trendline resistance and weekly 20.
I like calls over weekly 50sma or 123.
First target
- 140
I expect a pullback in the form of a flag before the next leg higher
QCOMQCOM making a bullish breakout
high volume with a gap above resistance
there is a reversal island and reverse head and shoulders pattern
this chip maker didn't participate in the last semiconductor rally
maybe now its time

QCOM Stock Analysis - Promising Mid-Term Long EntriesIn this analysis, I present my perspective on QCOM and identify two highly promising mid-term long entry zones, labeled as Buy Zone 1 and Buy Zone 2.
Technical Analysis:
QCOM has recently broken through its downtrend, indicating a potential reversal towards the upside. However, this breakout was accompanied by relatively weak price action and a subsequent retest that failed to generate a significant bounce. As a result, a falling wedge pattern has formed.
Buy Zone 2:
The falling wedge pattern suggests a higher probability of reaching Buy Zone 2, which coincides with the QCOM's long-term trend line. This zone presents a strong support level and offers an excellent entry point for mid-term long positions.
Buy Zone 1:
Alternatively, Buy Zone 1 also serves as a solid support level and provides an attractive entry opportunity. Traders considering this zone should be aware of potential market fundamentals that could push the price towards the lower range of the downtrend, around the $62-$56 region. If the price approaches this region, it would present an extremely strong investment position, taking into account all perspectives of QCOM.
This analysis is not financial advice, but rather a presentation of my personal views and ideas on QCOM's potential future movements.
