QQQ likely pathI expect the QQQ to slow and major overheated stocks to continue to bleed for a while longer. The entire market does not need to correct for ETFs to drop. Hot stocks like TSLA, PLTR, AMD and more can easily bring us to this demand zone for a bounce. I think we have a boring few weeks with a feb/march rally.
My plan:
Continue to focus on buying value at a fair price
QQQ trade ideas

$QQQ Daily: Key Demand Zone Ahead of PPI DataMarkets are at a critical demand zone on the NASDAQ:QQQ daily chart as we gear up for tomorrow's PPI report. 🔻 Will overnight selling continue, or can the bulls regain control and push prices higher ahead of the data? Let’s dive into the technical setup and potential scenarios!

$QQQ 5dte viewNASDAQ:QQQ 5DTE view
Ok, so this is the 5DTE View, so for Friday’s contract. We are under the 50DMA
494 -521 is the trading range for this weeks
The 1 week 35EMA is underneath our trading range and I will go over the in one of the videos this week as to why that is important.
We are not far away from the 4hr 200MA which is a big level to watch underneath us

$QQQ Recap of Last Week - Down on the Year - New Downtrend?NASDAQ:QQQ Recap of Last Week - Down on the Year - Bigger Downtrend Starting
Wow, what a chart. Last week we opened with a gap up above the 30 minute two moving average and then we hit the down gap from December 27 and that was also the top of the downtrend line. (Redbeard arrow)
From there, we took it all the way down to the downtrend line (green arrow) So underneath the 30 min 200MA, the 1he 200, the 35EMA, under the 50DMA, filled the gap from the first week and we closed at the bottom of the days range.
And as of right now premarket looks like we're gonna break down this down trend and take it lower
What a week!! 😅
New week trading ranges coming soon

Short QQQ Next Week: Brace for Potential Decline Amidst Bearish
- Key Insights: Given the current bearish trend in QQQ, it is essential for
investors to remain cautious. Key resistance is at 511, while immediate
support resides at 503. Declines may head towards 492-488 if the downtrend
continues, suggesting a focus on these critical levels for decision-making.
Sellers currently dominate, leading to expectations of sideways movement and
testing of support.
- Price Targets:
- Next week targets:
- T1 = 500
- T2 = 495
- Stop levels:
- S1 = 511
- S2 = 515
- Recent Performance: Over the past month, QQQ has dropped approximately 6%,
indicating a broader struggle within the technology sector. The bearish
candle patterns highlight persistent weakness, and a cautious approach is
warranted as QQQ nears crucial support. The trend has seen sellers overpower
buyers consistently, reinforcing negative sentiment.
- Expert Analysis: Analysts highlight that the QQQ faces significant supply
pressure and needs to reclaim resistance at 511 to shift sentiment. The
prevailing bearish outlook posits that if sellers maintain control, further
declines to the 492-488 range are plausible. Maintaining awareness of key
moving averages for major tech companies like AMD remains essential for
directionality.
- News Impact: The market is impacted by macroeconomic conditions, particularly
the fluctuations in Treasury yields hovering around 5%, which affect equity
valuations. Concerns about technology sector health, especially with high-
profile companies struggling against key moving averages, continue to shape
sentiment and trading strategy for QQQ.

QQQ Technical Analysis and GEX Option StrategyTechnical Analysis Overview:
1. Market Context: QQQ is currently trading within a descending wedge pattern, a structure often indicative of potential breakout setups. The price is approaching the wedge's lower boundary, showing signs of decreasing volatility.
2. Key Levels:
* Support:
* $503.92 (near-term support and key GEX8 level).
* $497 (3rd PUT wall level and critical psychological area).
* Resistance:
* $515.27 to $516.91 (first resistance zone aligning with 2nd CALL wall).
* $520 to $527.87 (upper wedge boundary and CALL resistance).
3. Indicators:
* MACD: Bearish momentum with a slightly rising histogram indicates slowing downside pressure, but no clear reversal signal yet.
* Volume: Declining volume into this wedge suggests potential accumulation but requires confirmation.
4. Trade Setup:
* Bullish Scenario:
* Entry above $510 (break above wedge boundary and reclaim of key resistance).
* Target: $515 and $520.
* Stop-Loss: $503 (below recent lows).
* Bearish Scenario:
* Entry below $503.
* Target: $497 and $490 (down to the PUT walls).
* Stop-Loss: $507.
GEX Analysis for Options Trading:
1. Gamma Exposure (GEX):
* Positive gamma walls at $515 (2nd CALL wall) and $520 suggest strong resistance if prices climb.
* Negative gamma at $503 and below highlights potential acceleration to the downside if breached.
2. IVR and Sentiment:
* IVR stands at 27.2%, indicating relatively moderate implied volatility. Options traders might prefer strategies with defined risk/reward setups like vertical spreads.
3. Option Strategy Suggestions:
* Bullish:
* Call Debit Spread: Buy $515 CALL, Sell $520 CALL.
* Expiry: Choose a date with moderate time decay, e.g., 2 weeks out.
* Bearish:
* Put Debit Spread: Buy $500 PUT, Sell $495 PUT.
* Expiry: 1-2 weeks out, targeting the next gamma wall.
Market Direction Outlook:
* Based on the wedge formation, declining volume, and the position relative to gamma walls, QQQ is at a pivotal decision point. A breakout above $510 could see a bullish continuation toward $515-$520, while a breakdown below $503 would confirm bearish momentum. Traders are advised to monitor pre-market activity for any gap or sentiment shift.
Disclaimer:
This analysis is for educational purposes only and does not constitute financial advice. Please consult with your financial advisor or conduct your own research before executing trades. Always ensure proper risk management in your trading strategy.

QQQ: Will Start Growing! Here is Why:
It is essential that we apply multitimeframe technical analysis and there is no better example of why that is the case than the current QQQ chart which, if analyzed properly, clearly points in the upward direction.
❤️ Please, support our work with like & comment! ❤️

QQQ trying to breakout of downtrendA gap up and attempt to breakout of downtrend today. However, regular hours trading was pretty flat. You can see the high and low wicks on the candle testing support and resistance, but ultimately, price went nowhere after the gap up. Tomorrow should give us a good idea on which way it is going.

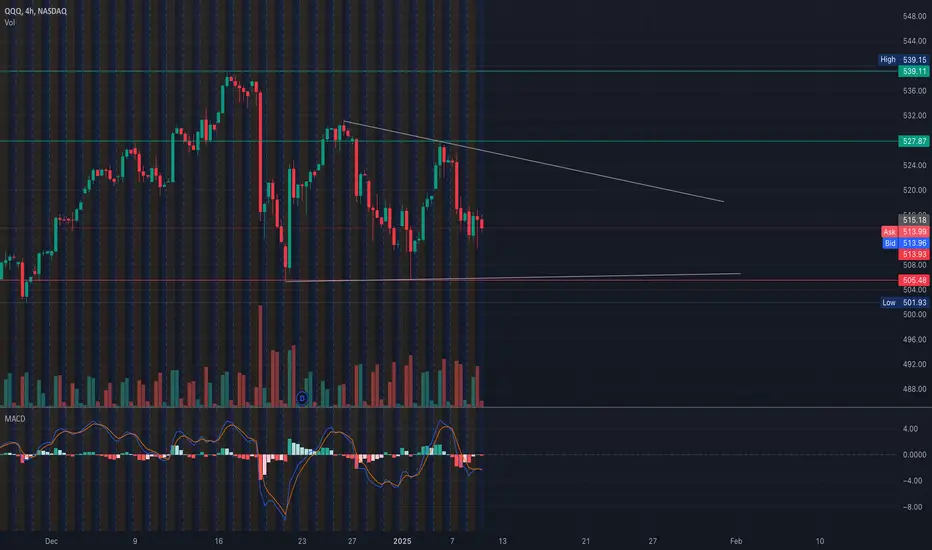
Technical Analysis and GEX Insights for QQQMarket Structure and Price Action
QQQ is currently trading below the critical resistance level of $527.87, with a descending trendline that aligns with recent lower highs. This reflects bearish momentum in the short term. Support at $513 has been tested multiple times, indicating buyer interest around that area.
The recent price movement suggests consolidation within a descending triangle, which is typically a bearish continuation pattern. However, a strong breakout above the trendline could invalidate this structure and lead to upward momentum.
Support and Resistance Levels
1. Resistance:
* $527.87 (major horizontal resistance).
* $522 (aligned with GEX and 2nd Call Wall).
2. Support:
* $513 (highest negative NETGEX and PUT Support).
* $505.48 - $504.40 (lower boundary of the triangle and 3rd PUT Wall).
Gamma Exposure (GEX) Analysis
* Call Resistance: $514 - $522 levels show minimal gamma exposure to calls, with 33.53% GEX aligning with $514.
* Put Walls: Significant negative GEX exposure at $513 and $510, marking these as critical support zones.
* Directional Bias: GEX structure leans bearish, with PUT dominance around current levels.
Indicators Overview
* MACD: Bearish crossover, signaling downward momentum, but with a possibility of consolidation if histogram bars begin shrinking.
* Volume: Declining, suggesting weakening conviction in the recent price movements.
Trade Scenarios
1. Bullish Scenario:
* Entry: Above $514, with confirmation of strong volume.
* Targets: $522 and $527.87.
* Stop-Loss: Below $510.
2. Bearish Scenario:
* Entry: Breakdown below $513.
* Targets: $505.48 and $504.40.
* Stop-Loss: Above $514.
Conclusion
QQQ is trading within a consolidation pattern with bearish pressure. Key levels to watch are $513 for breakdowns and $514 for potential breakouts. Gamma positioning supports bearish bias, but sharp moves can invalidate the analysis.
Disclaimer: This analysis is for educational purposes only and does not constitute financial advice. Always conduct your own research and risk management.
QQQ big moves or big ranges...I feel we are in "The middle" and I don't want to diddle....
Looking for mostly range trading for the next few months until Q1 earnings for big tech start and we see if they are on track and even more important, Forward Earnings and outlooks.
Remaining Cautious for now.

Qqq ... 10% correction From July to December Qqq traded inside a rising wedge..
That rising wedge was broken and retested
The target here would be 480-486.
But a trip down to daily 200sma or weekly 50sma is most likely
So what has been the hold up..
I looked at this from a few angles and I think Qqq is creating a Bearish Descending triangle that will be broken late this month.
Bulls will probably see a bullflag
But I think it can be both but the bullflag will have to head lower
And the first target would be 492 by End of month
As far as the tech sectors go..
XLK , the biggest sector
When u focus on the last 30days price looks like it's trading sideways
But zoom out and you'll see it's the same as Qqq with respects to the wedge
Price has been holding above weekly
21ema at 230... Below that and next leg down starts . Until then 230-241 is distribution
Soxx and SMH are both Chip sectors..
Nvda and TSLA follow SMH more
While AMD and Qcom follow Soxx
Soxx
Daily 50sma crossed below 200 a few weeks back.. last time this happened was 2022.. I think this weakness in chips will last for months..
Price closed back below 200sma this week and I don't think it gets back over it until this correction is done. The only safe long is over 240 , everything else is knife
SMH
It's going to be more bag holders here
. Price got rejected hard here at 264 resistance... In the next few days chips will be the weakest.. expect SMH to pull back to weekly 50sma or price action at 237..
If 237 is losses then we head back to Sept levels.
XLC
This is the sector of Meta, Googl and Nflx
Honestly this is the most dangerous sector to be long in! Look at the monthly Candle, RSI ,Money flow and stochastic.. when ever I see this I think Dotcom bust.
Fell out of wedge similar to XLK and Qqq..
Also trading sideways similar to XLK
My target is 88.. I doubt this sector makes its out of Q1 alive
This is the sector of
Amzn and TSLA
Rising wedge again followed by a bear channel.. price is hovering above the 50sma.. once that breaks my target is 212-214 previous ATH..
Daily money flow is almost oversold though so id wait for a break below 50sma to short and be ready to eject at 214 for a dead cat bounce..
Focusing on the smaller time frames , I think Qqq bounces back to 520-523 before the next leg down.. hourly has went oversold on NQ.... I don't think Qqq breaks back over 523 and that's where id reload shorts....
One of my main indicators is XLK..
It's the biggest sector..
If it breaks over 241 then this correction is over and I was wrong but if it breaks below that weekly 21ema then the next major leg down has started.
Vix is showing bullish ascending wedge.. usually vix shows opposite pattern of indexes.. if you see a double top on spy normally there's a double bottom on Vix .

QQQ bullish flag?I just bought TQQQ. I think we are consolidation for a big move but is going to take some time. I will add if a see that the bullish flag still up. I'll take the loss if the pattern is busted.


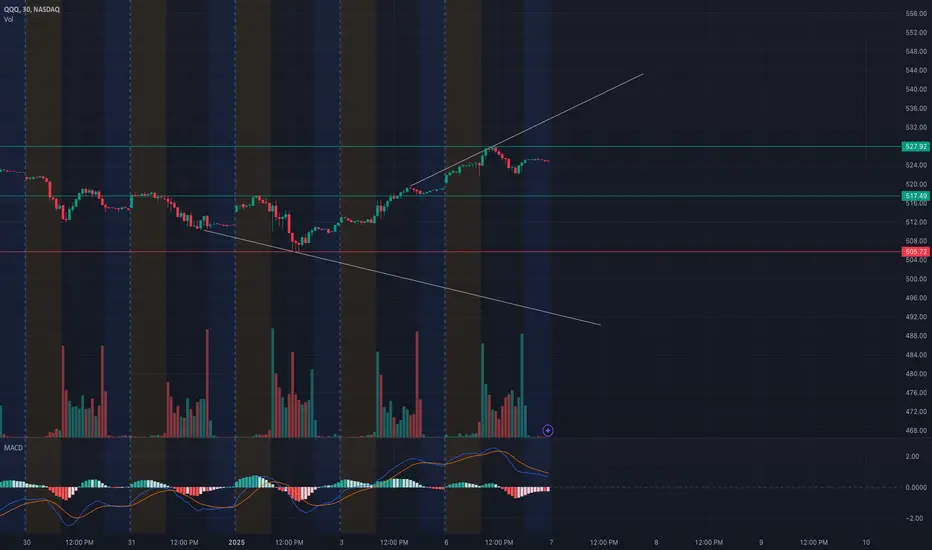
QQQ Consolidating at Key Resistance! Will Momentum Push It Highe
30-Minute Timeframe Analysis
* Trend Overview: QQQ is showing strong recovery, trading near $527.92 resistance after a breakout from a descending trendline. The price is consolidating, indicating indecision at current levels. The possibility of a market gap up or down at the open may change this structure, so traders should remain flexible and reassess their plans accordingly.
* Key Levels:
* Support: $517.49 and $508.20 are critical levels to hold if the price pulls back, particularly during a gap down.
* Resistance: $527.92 and $531.21 are key levels for further bullish momentum, especially if the market gaps up.
* Indicators:
* MACD: Bullish but flattening, signaling potential consolidation unless a gap up drives renewed momentum.
* Volume: Recent volume surge supports upward movement, but a breakout needs confirmation with sustained volume.
1-Hour GEX (Gamma Exposure) Insights
* Key Gamma Levels:
* Positive GEX: $527 and $531 are strong call resistance levels, with $527 serving as the highest positive gamma wall. A gap up may lead to a test of these zones.
* Negative GEX: $523 and $521 are key put support levels, protecting the downside if the market gaps down.
* Options Metrics:
* IVR: Low at 17, reflecting a calm market environment with potential for sudden moves.
* Calls vs. Puts: Slightly bearish skew with puts at 2.5%, signaling mild caution.
* Actionable Gamma Zones:
* Bullish Scenario: Sustained move above $527.92 or a gap up could lead to a rally toward $531.21 or higher.
* Bearish Scenario: A gap down below $523 could activate put support and drive the price toward $517.49.
Trade Scenarios
* Bullish Setup:
* Entry: Break and hold above $527.92, or after a gap up that sustains above $528.
* Target: $531.21 and $535.00.
* Stop-Loss: Below $525.00.
* Bearish Setup:
* Entry: Breakdown below $523.00, or after a gap down that fails to reclaim $524.
* Target: $517.49 and $515.00.
* Stop-Loss: Above $526.00.
Important Note for Traders
* Market gaps at the open can significantly alter the current outlook. Reassess price action during the pre-market session and adjust your strategy to align with updated conditions.
* If you need technical analysis for QQQ or any other stock, feel free to contact me for personalized and detailed insights.
Disclaimer: This analysis is for educational purposes only and does not constitute financial advice. Please conduct your research and trade responsibly.
QQQ Buy/Reversal to 526 Sell to 497Downwards trend Channel which Upwards Started at 497 Support. While we remain inside the trend channel, look for a break above 519 level and retest for a buy up to 526 and Take Profit. Watch for reversal at 526 , break and retest 526 to consider more trending upward movement. Reversal at 526 we Sell Down to 497 For the Rest of the week .

Stock Market | TSLA NVDA AAPL AMZN META GOOGL MSFTStock Market | TSLA NVDA AAPL AMZN META GOOGL MSFT

QQQ 1-Hour Technical Analysis and GEX Insights-Jan. 3Technical Analysis (1-Hour Chart)
* Trend and Price Action:
* QQQ is trending downward on the 1-hour chart, respecting a descending trendline.
* The price has tested the $505.34 support level and is attempting a minor recovery. However, the overall structure remains bearish.
* Volume: Moderate volume during recent declines suggests continued selling pressure.
* Indicators:
* MACD: Signs of a potential bullish crossover, which could indicate a short-term recovery if confirmed.
* Stochastic RSI: Rising from oversold levels, signaling a possible bounce or consolidation.
* Key Levels:
* Support Levels:
* $505.34: Critical support level; breaking below this could lead to further declines.
* $500.00: Psychological support and significant GEX activity zone.
* Resistance Levels:
* $511.87: Immediate resistance aligning with the descending trendline.
* $515.00: Secondary resistance with CALL wall activity, marking a critical breakout level.
GEX Insights for QQQ
* Gamma Exposure (GEX):
* Positive GEX Zones:
* $515.00: Key CALL wall, acting as a significant resistance zone for upside movement.
* Above $520.00: Positive gamma increases, signaling a strong resistance cluster.
* Negative GEX Zones:
* $505.00: Highest negative gamma exposure and a critical support zone.
* Below $500.00: Gamma exposure becomes more negative, increasing downside volatility.
* Options Metrics:
* IVR (Implied Volatility Rank): 20.1%, indicating relatively low volatility pricing.
* Options Flow:
* Calls: Modest activity near resistance levels at $515-$520.
* Puts: Concentrated near $505 and $500, reflecting strong protective positioning by investors.
Trade Scenarios:
Bullish Scenario:
* Entry: Above $512.00 with confirmation of momentum.
* Target: $515.00 (initial), $520.00 (extended).
* Stop-Loss: Below $510.00 to limit downside risk.
Bearish Scenario:
* Entry: Below $505.00 with strong volume.
* Target: $500.00 (initial), $495.00 (extended).
* Stop-Loss: Above $510.00 to cap losses.
Conclusion
QQQ is at a pivotal level, with $505 acting as a critical support zone. A breakout above $515 could trigger bullish momentum, while a breakdown below $505 could lead to further downside pressure. GEX levels provide clear zones to monitor for potential trading opportunities.
Disclaimer: This analysis is for educational purposes only and does not constitute financial advice. Always conduct your own research and manage risk responsibly.

SPYQQQ Day Trade PlanHappy New Year!!
Watch for momentum(Volume). Watch for hesitation(Low volume). Simple Plan. Simple Execution. Happy trading.

QQQ: Annual outlookHey Friends,
Here is the annual outlook for QQQ!
Annual Levels:
Ref: 550.31 (Reference Target)
High 1: 575
High 2: 622.009
High 3: 668.81
Range Ceiling: 725
Low 1: 462.92
Low 2: 420.57
Low 3: 374.57
Range Floor: 322
ARIMA Forecast
Point Forecast at Day 252: 532.2314
80% Upper Confidence Level at Day 252: 707.6069
95% Upper Confidence Level at Day 252: 800.4451
80% Lower Confidence Level at Day 252: 356.8559
95% Lower Confidence Level at Day 252: 264.0177

Nasdaq (QQQ): Ready to Go Higher; Buy Signal Alert 💡 Setup Overview:
This bullish setup is perfect for those who love buying dips. The green box highlights an ideal entry zone supported by Fibonacci retracement levels.
🔍 Key Levels to Watch:
Entry Zone: $489.88 - $501.27
Stop-Loss: $488.67
Targets:
First Target: $526.47
Second Target: $551.80
📊 Strategy:
The focus remains on buying dips for indices like SPY and QQQ, avoiding shorting positions. This plan leverages Elliott Wave patterns and Fibonacci extensions for precise entry points.
🕒 Expected Timeline: Medium-term hold.

QQQ Technical Analysis (1-Hour Chart). Jan 2, 2025Price Action
* QQQ is trading in a descending channel, showing a clear downtrend over the short term.
* The price has tested the upper trendline resistance and failed to break above, confirming continued bearish pressure.
* The price is now near the middle of the channel, consolidating with slightly declining volume.
Indicators
* MACD: Bearish momentum persists as the histogram shows red bars and the MACD line remains below the signal line.
* Stochastic RSI: The indicator is nearing oversold territory, which may indicate a potential bounce or consolidation before continuing the trend.
Key Levels
* Resistance: $517 (upper channel resistance) and $514 (HVL resistance as per Options GEX).
* Support: $505 (lower channel boundary and put wall support from GEX data).
Trading Plan
1. For Longs:
* Wait for the price to break above $514 with strong volume and confirmation from MACD (crossover) and Stochastic RSI moving out of oversold.
* Entry: Above $514.
* Stop Loss: Below $505.
* Target: $522 (near next resistance level).
2. For Shorts:
* Enter if the price rejects at $514 or breaks below $505 with strong bearish momentum.
* Entry: Below $505.
* Stop Loss: Above $514.
* Target: $500 or lower channel boundary.
QQQ Options GEX Analysis (Daily Chart)
Gamma Exposure Levels
* Call Wall Resistance: $517 and $522, indicating strong resistance levels where call activity is concentrated.
* Put Wall Support: $505, marking a significant area of support from high put open interest.
* HVL at $514 is a critical pivot point that aligns with both GEX and price action resistance.
Volatility Insights
* IV Rank (IVR): 17.8, indicating relatively low implied volatility compared to historical levels. Options premiums may be cheaper for strategies like long calls or long puts.
Options Strategy
1. Bullish Strategy (If QQQ breaks above $514):
* Buy the $520 Call (weekly expiry) to capitalize on momentum toward $522–$525.
* Stop Loss: Close the position if QQQ falls below $514.
* Profit Target: Exit at $522 or $525.
2. Bearish Strategy (If QQQ breaks below $505):
* Buy the $500 Put (weekly expiry) to benefit from a drop toward $500 or lower.
* Stop Loss: Exit if QQQ reclaims $505.
* Profit Target: $500 or lower.
Disclaimer
This analysis is for educational purposes only and does not constitute financial advice. Always perform your own due diligence and manage risk appropriately when trading stocks or options.

QQQ Fib Levels - just touched 2.0I used to be a big advocate for Fib levels, but I feel like the lead me astray more times than helped, but none the less here is a high-level look with my estimate of fib levels. If I did it correctly, QQQ just touched off the 2.0 level. This could explain the weakness we saw this holiday season instead of the normal "Santa Claus Rally". Will we get a sizeable correction in 2025? Don't know, but there is clear weakness with some form of pullback coming. Just short term or something bigger, hard to know yet. I'm in the camp of a pump and dump on the Trump administration. How does it go, buy the rumor, sell the news. Feels like it to me.
Happy New Year!

Invesco QQQ Trust (QQQ): Long-Term Elliott Wave Analysis📊 Chart Context: This analysis outlines the long-term Elliott Wave perspective for the Invesco QQQ Trust (QQQ), a tech-heavy ETF tracking the Nasdaq 100 Index. The current structure highlights a bullish trajectory with anticipated corrections before the next impulsive leg.
Elliott Wave Breakdown
Macro Structure:
- QQQ is in a right-side bullish structure, showing impulsive waves consistent with a long-term uptrend.
- Wave (III) was completed around 2021, followed by a multi-phase correction that formed Wave (IV).
Current Progression:
- Wave (V) reached a peak near $511.23, completing the first subwave of the larger bullish cycle.
- A corrective Wave II is anticipated, forming an ABC pattern, targeting deeper retracements.
Wave II Projection:
- Wave A may find initial support in the $460–$480 range.
- Wave B is expected to rebound before Wave C completes the correction near $420–$440.
Invalidation Level:
- The invalidation level for the bullish structure stands at $254.38. A break below this would negate the current wave count.
Key Levels to Watch
Support Zones:
- $480: First key support during Wave II correction.
- $420–$440: Deeper support for Wave C completion.
Resistance Zones:
- $560: Immediate resistance zone, marking the next potential peak for Wave III after correction.
For Long-Term Investors:
- Accumulation Zone: Between $420–$480 during the Wave II correction phase.
- QQQ presents a strong case for holding and adding positions as the broader bullish structure remains intact.
Fundamental Catalysts
Macro Environment:
- QQQ remains sensitive to Federal Reserve policies, especially interest rates, which heavily influence tech valuations.
- Economic growth in the tech sector will likely sustain the bullish narrative.
Tech Sector Growth:
- Continued advancements in AI, cloud computing, and other disruptive technologies will bolster the underlying Nasdaq 100 companies.
Conclusion
The QQQ chart aligns with a strong bullish Elliott Wave framework, with short-term corrections providing opportunities for strategic entries. The long-term trajectory suggests higher highs in the next wave cycle, targeting levels beyond $580.
💬 Drop your thoughts below! Are you holding QQQ for the long run, or trading the upcoming correction? 📈
