$QQQ Poised for Lift-Off: Flipping Resistance, Eyeing $470-$475!🚀 NASDAQ:QQQ Poised for Lift-Off: Flipping Resistance, Eyeing $470-$475! 🚀
As mentioned in my recent post, we’ve successfully flipped the $443.14 resistance into support—a key technical shift!
🔹 Momentum Building:
- Wr% Indicator: Making higher lows and advancing steadily towards the Red Barrier.
- Volume Gap: Still in play and ready to be filled.
With a higher low now established, I believe we’re set up for a potential move to $470-$475 next week.
📈 Let’s see how this plays out—exciting times ahead!
💡 Have an amazing weekend, friends!
Not financial advice
QQQ trade ideas

Learning The Excess Phase Peak Pattern : How To Identify/Use ItThis new tutorial video is for all the new followers I have on TradingView who don't understand the Excess Phase Peak pattern (EPP) yet.
I received a question from a new follower yesterday about the EPP patterns. He/She could not understand what they were or how to use/identify them.
This video should help you understand what the EPP patterns are, how to identify them, how to trade with them, and how to identify/use proper expectations with them.
I hope this video is informative and clear. Remember, price only does two things...
FLAG or TREND - NOTHING ELSE
And the EPP pattern is the CORE STRUCTURE of price that happens on all charts, all intervals, and all the time.
The second pattern, the Cradle pattern, is part of the EPP pattern, but it acts as another price construct related to how to identify opportunities in price action.
Get some.
#trading #research #investing #tradingalgos #tradingsignals #cycles #fibonacci #elliotwave #modelingsystems #stocks #bitcoin #btcusd #cryptos #spy #gold #nq #investing #trading #spytrading #spymarket #tradingmarket #stockmarket #silver

SPY/QQQ Plan Your Trade For 4-11 : Break-Away in CarryoverToday's Break-away pattern suggests the SPY/QQQ will attempt to move (break) away from yesterday's Body range. I believe this trend, after the recent Ultimate Low in price, will be to the upside.
I know a lot of people are asking, "why do you think the markets are going to rally now - after you suggested the markets would trend downward?"
Things have changed now that we have a 90-day pause in the tariff wars. Yes, China is still an issue - but the rest of the world seems to have a pause on the tariff wars as negotiations continue.
I believe the removal of the tariff pressure on the markets will result in a moderate upward trend as we move into Q1:2025 earnings season.
Still, I don't believe we will see new ATHs anytime soon. But I do believe the 580+ level on the SPY is a potential high price level that can be reached before the end of April 2025.
Gold and Silver are moving into a GAP trend move today. I believe the GAP will be to the upside and I believe Gold and Silver will continue to rally.
Silver is really low in terms of comparison to Gold. Silver could make a very big move to the upside over the next 30+ days.
BTCUSD is still consolidating into the narrow range I suggested would happen before the bigger breakdown event near the end of April (into early May).
Everything is playing out just as I expected. The big change is the removal of the tariffs for 75+ nations (for now). That will give the markets some room to the upside and we need to understand how price structure is playing out into an A-B-C wave structure.
Get some.
#trading #research #investing #tradingalgos #tradingsignals #cycles #fibonacci #elliotwave #modelingsystems #stocks #bitcoin #btcusd #cryptos #spy #gold #nq #investing #trading #spytrading #spymarket #tradingmarket #stockmarket #silver

Nasdaq: Higher Low or Lower High?NASDAQ:QQQ
Are we making a lower low or a higher low?
This $438-$444 previous resistance needs to hold and be flipped into support to continue this rally.
If not then we are going to break the lows!
Not financial advice

4/8/25 - $qqq - Don't fall for the meme4/8/25 :: VROCKSTAR :: NASDAQ:QQQ
Don't fall for the meme
So.
You are following Trump on Truth Social.
(strike 1)
You are believing Dalio about the state of geopolitics.
(strike 2)
Jim Cramer is on in the background yelling
(strike 3)
Rando on X accounts "AI is a bubble"
(strike 4)
You can taper a USD ponzi scheme
(strike 5)
... i could go on.
Here's the reality.
- The stock market is real money. "Money" being defined as "something that has productive value". It it the best money? Maybe. BTC is pretty good too. Each have their own properties. Is the USD "money"? Well. Yes, but mostly no. It's mostly a liability.
- Is the global economy melting down? No. Have you not seen what AI can do beyond one-shotting prompts? This is far from what dotcom was. Dotcom never replaced people/ labor and services. So while there are a lot of meme companies out there attaching AI to their business descriptions, the core suspects are monetizing this today, and it's only getting more impressive (not by the week), but the *day*
- Does the debt market matter more than stonks rn? Yes. Up until a few days ago, lower yields (on UST's) emboldened speech to not give a F. Well, that's changed. Back to "you can't taper a ponzi". So better own productive assets. Gold has sniffed this out. BTC usually follows 3-6 months on Gold (as a smaller asset class) unless China decides to go full retard Jerome (which they might). And historically, China stimmy is the trigger for BTC getting sent. Weird the moon bois don't track this. But put it in the back of your mental model.
- So what do we do here? Productive assets that have visibility toward growth not just this year but into the next 3-5Y and are trading where cash yields and healthy balance sheets are >5% FCF's but ideally closer to 10%.
- NASDAQ:NXT remains in a tough tide. Solar as a category has just been so scammy. And even tho US builders are sourcing mainly from Vietnam (not China) etc. etc. people don't do the work in a correlation 1 world. So do we retrace the $32/shr gap? Idk. But I sized up so hard today. And tmr I'll be updating if we gap lower. it's 33% of book today. i take to 40% if we get to sub $35. and i get to 50% (LEAPS!) if we close dat gap.
- $OBTC. bitcoin at 8-10% off spot? lol. size manage, but definitely a good way to play the beta with larger size given the discount. almost like leverage without leverage. limits only. v illiquid. hence the discount.
- I like NASDAQ:BLDE here at $2.5 the TL;DR is this. 1/ cash generative. 2/ main biz is organ transport, and consumer biz is cash generative ans mostly rich ppl Uber in the sky 3/ two-thirds of the valuation is net cash and 4/ you can sell august 15 2025 calls for 55-60c today (at $2.5/shr) locking in 20% yield with some downside production (where the stock would theoretically trade close to zero valuation and you'd honestly want to own the stock anyway). so i've sized this up to nearly 20% of book.
- I like $UBER. 6% fcf yields. not tariff exposed. but it's defn travel-punching bag. I get it. Gap in the high 50s *shouldn't* fill, but i'm prepared if/when only because we're trading like everything is the same. That's what the room-temperature "I buy ETFs" crowd deserves. Pick and choose. So if we dump, this gets dumped and we go back there, I'd consider this an absolute gift. Flows vs. fundamentals already dominant. Better beta than mkt as we re-rip toward ATHs (my view remains) this year.
- $GAMB. 15% fcf yields. not tariff exposed. normies r gonna gamble. they have founder-led beats/raises. M&A, low liquidity keeps this waffling but ultimately a winner.
- $VST. trades like NASDAQ:NVDA (so does NASDAQ:NXT ) lol. it's a f'n utility that generates piles of cash, is insulated from the hyperscaler fall out (if/does happen... which is NOT my base case), but utimately has tons of power to serve up. $1.4M/MW cheap. 6% fcf yields. no brainer.
- $NVO. honorable mention. Euro's can't seem to grow a pair and buy this obvious cash generative winner. GL.
mm..
wealth isn't measured in USD's.
<3
V
PS - i think we go higher from here. avg. stock down 30% on my calculation from peak. index doesn't tell story. could be another 5-10% on index? yeah w/e. again back to point 1. in a ponzi scheme you own real things... and the USD is the biggest shit meme coin on the planet. it has value for a small period of time, but sooner than later you gotta put it to work. don't hold the USSA bag.

Giant Head & Shoulders Forming into 2028A long-term set of macro circumstances, impacted by debt, QE and geopolitics are playing out for a very big Head & Shoulders through about 2028.

Island Bottom CONFIRMED on $QQQ IF we GAP up tomorrow!Island Bottom CONFIRMED on NASDAQ:QQQ IF we GAP up tomorrow!
I only believe we GAP up tomorrow IF there is news of China coming to the negotiation table with the U.S after they have raised the Reciprocal Tariffs to 104%.
If this doesn't happen then this isn't confirmed and we see a retest of $400 IMO!
I'm not playing this as a trade until we get confirmation! Too dangerous!
Not financial advice

Level to level Rejecting 428 level and we're making lower highs
I believe tomorrow we can open at Mondays lows
Since tariffs rate will go into effect at 12:01am ET.

Need clarity on what's most likely to come? I got u!Price has followed my path to a tea (Not exact prices but more of the cycles of price movement)
We will hit 450 on QQQ by Tuesday and Trump is most likely to back peddle on tariffs for select countries.
TARIFFS ARE ONLY MEANT TO REDUCE THE 10 YY FOR TRUMP TO REFINANCE OUR NATIONAL DEBT.
Nothing else.
Please see my black line of what I think price action will do.

Foundation of Technical Trading: What Makes a Chart Tradable?The Foundation of Technical Trading
There is an abundance of information on price charts, technical methods, indicators, and various tools. However, the required first step is to understand basic market structure. Without this foundational knowledge, technical applications risk becoming inconsistent and disconnected from broader market behavior.
It is also important to question whether technical charts and tools are effective at all. What makes the market responsive to a trendline, a pattern, or an indicator? And why, at other times, do these tools seem entirely irrelevant? Is the market random? If certain events are predictable, under what conditions can such occurrences be expected?
Experiment: Random Charts
Here is an illustration of four charts; two showing real price data and two randomly generated. While some visual distortion gives away subtle differences, there are more refined methods to construct this experiment that makes telling the difference between real and random almost impossible.
All these charts show viable patterns and possible applications. When presented with these, even experienced people tend to construct narratives, whether or not structure is present. This raises a fundamental question; how can one distinguish real occurrences from coincidental formations on a chart? In case all movements are considered random, then this should indicate that applied methods perform no better than coincidence?
Bias and Distortion
It’s also important to comprehend the influence our perception. As humans we are wired to find patterns, even in random data, which can lead to various cognitive biases that distort our interpretation. For example, confirmation bias may lead us to focus only on evidence that supports our expectations, while apophenia causes us to see patterns where none exist. Similarly, hindsight bias can trick us into believing past patterns were obvious, which can develop overconfidence in future decisions. Awareness of these biases allows us to approach technical tools and charts with greater objectivity, with more focus on probabilistic methods and calculated risks.
Experiment: Random Levels
Perform the following experiment; open a chart and hide the price data. Then draw a few horizontal lines at random levels.
Then reveal the price again. You’ll notice that price can touch or reverse near these lines, as if they were relevant levels.
The same thing can happen with various indicators and tools. This experiment shows how easy it is to find confluence by chance. It also raises an important question, is your equipment and approach to the markets more reliable than random?
Market Disorder
Financial markets consist of various participants including banks, funds, traders and algorithmic systems. These participants operate with different objectives and across multiple timeframes resulting in a wide range of interpretations of market behavior. Trades are executed for various reasons such as speculation, hedging, rebalancing, liquidation or automation; directional intent could be unclear. For instance, the prior may serve to offset exposure, and portfolio rebalancing could require the execution of large orders without directional intent.
Technical and chart-based trading likely makes up a minor segment of the overall market; even within this subset, there is considerable variation in perception and interpretation. There could be differences in timeframe, reference points, pattern relevance and responses to similar information. The market is broader, more complex and less definitive than it appears. The point is that markets contain a high degree of structural disorder, which means most assumptions should be questioned and perceived as estimative.
The effect of buying and selling pressure on multiple timeframes sets the foundation for oscillation in price movements, rather than linear and monotonic movements. This pattern of rising and falling in a series of waves sets the points for where the current structure transitions between balance and imbalance. An overall equilibrium between buying and selling pressure results in consolidative price movement, whereas dominance leads to trending or progressive movement.
Volatility Distribution
To answer the main question: What differentiates real market behavior and charts from random data, and ultimately makes it tradable, is the distribution of volatility. This forms the basis for the phenomenon of volatility clustering, where periods of high volatility tend to follow high volatility, and low volatility follows low volatility. It is rare for the market to shift into a volatile state and then immediately revert to inactivity without some degree of persistence. Research supports the presence of this volatility persistence, though with the important caveat that it does not imply directional intent.
Volatility Cycles
These phases tend to occur in alternation, known as volatility cycles, which set the foundation for tradable price structures. This sequence consists of a contractive phase, marked by compression in price movements, followed by an expansive phase, characterized by increased volatility and directional movement. The alternation reflects shifts in underlying buying and selling pressure. This behavior offers a practical approach to interpret market behavior. A more detailed explanation of the concept could be explored in a future post.
Conclusion
While the idea of profitability through technical trading is often questioned, it remains a viable approach when based on sound principles. The edges available to the average trader are smaller and less frequent than commonly presumed. The concepts of volatility and the ability to locate areas of imbalance forms the basis for identifying conditions where market behavior becomes less random and more structured. This sets the foundation for developing technical edges.
The content in this post is adapted from the book The Art of Technical Trading for educational purposes.
$QQQ Trading Range for April 8 2025NASDAQ:QQQ Trading Range for April 8 2025
Opened near the top of the trading range for the day!! How are you guys going to play this?

$QQQ Review of Black Monday
Alright - Yesterday - We stayed completely with in the implied move - you can see that both sides got tested which gave us some wild swings. Spreads on both ends paid. 10% intraday moves
We hit the bottom of the implied move, the top of the implied move and we saw resistance at the 35EMA.

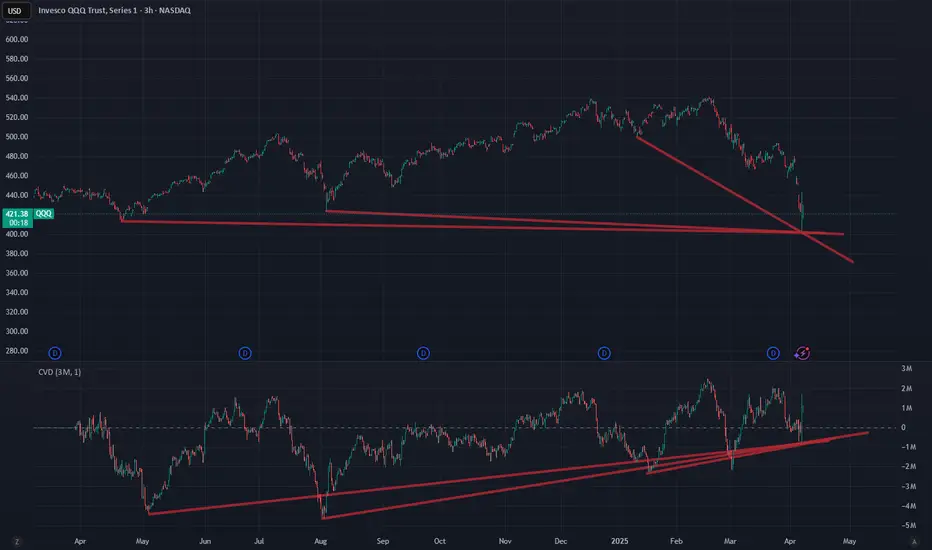
QQQ - The Time Is NowApril is wild. So take a deep breath and ... relax.
Because for traders with a longer-term investment horizon, now may be THE time to buy.
A look at the QQQ in the big picture shows that extremely strong bullish divergences have built up in the cumulative volume delta.
Yes, the crash was fast and violent. But, as we know: Fast is fake.
It can therefore be assumed that the QQQ will recover relatively soon.
Times may remain exciting for day traders, but investors on the hunt for bargains will be happy about perfect entry prices.
QQQ Major Trend BreakThe uptrend from the 2022 low has finally been broken and we also have a shorter term bear flag that has developed since the break as well. I'd consider this a very significant break that will likely lead to a move down to $405. We may see some relief there, but I expect that to break eventually as well which should lead to a full retracement back down to the 2022 lows.
It is starting...

$QQQ Recap of Last Week Historic DrawdownA historic week with unprecedented tariffs not seen since right before the great depression.
NASDAQ:QQQ We broke many supports and are looking for Support
Stay Tuned - Today's Trading Range is coming out.
Don't rush into a trader just to trade - But also, if you see a great opportunity take it.

SPY/QQQ Plan Your Trade For 4-7 : POP In Counter Trend ModeToday's POP pattern in Counter Trend mode suggests the markets will find support and attempt to POP upward a bit.
I expect the SPY to attempt to reach levels above 505 today. Possibly trying to peak near 510.
The same thing will happen with the QQQ - a potential rally (POP) higher targeting the 420-425 level.
Watch this video TWICE if you really want to understand what is taking place in the markets right now.
The tariff issue will settle over the next 15+ days. The SPY/QQQ are moving into the EPP Consolidation Phase (just like I've been telling you for months now).
BTCUSD is moving into a BREAKDOWN phase and will likely target $63k over the next 30+ days.
Gold and Silver reacted to the breakdown of the SPY/QQQ as they always do - PANIC SELLING.
Now that the panic selling pressure appears to be subsiding, Gold and Silver should build a base and begin an explosive move higher - targeting $4200-4500 for gold and targeting $41-44 for silver.
We live in exciting times and I still believe the US markets will DOUBLE or TRIPLE over the next 5-10+ years.
Get Some.

QQQ Crashes to Demand Zone! Market on Edge After Tariff Shock🔻 Market Context
The Nasdaq-100 ETF (QQQ) took a severe hit after Trump’s proposed tariffs rattled the broader market. Investors fled risk-on assets, dragging tech-heavy indexes into a sharp sell-off. This capitulation-type flush aligns with the "risk-off" tone the options market has hinted at for days.
Technical Analysis (1H + SMC)
QQQ broke structure decisively (BOS) and formed a bearish flag within a descending channel. Current price is hovering near the $420 support—this level acted as a major BOS zone, and we’re now testing it again from above.
The Smart Money Concepts (SMC) show multiple CHOCHs failing to reclaim higher liquidity zones around $475–$480, marking this area as a strong distribution zone. MACD and Stoch RSI are near oversold levels, showing momentum exhaustion, but no clear bullish divergence yet.
A small consolidation box is forming just above the demand zone. If this zone holds, a short-term relief bounce to retest $440–$448 could be in play. However, a breakdown below $419 would trigger further downside into the $405–$400 region.
GEX-Based Options Sentiment (1H)
* Highest Negative NET GEX / PUT Support is currently at $420, aligning perfectly with our price action floor.
* GEX10 at $434 and GEX9 at $440–443 form resistance blocks for any short-term bounce.
* The HVL at $475 (04/07 expiration) remains a major gamma magnet only if bulls reclaim $450+ levels.
From a flow standpoint:
* IVR: 101.8 – Options are relatively expensive.
* IVx Avg: 56.7% – Increasing volatility confirms fear.
* PUT$: 23.5% dominance – Bearish pressure is heavy.
* GEX is deep in the bearish zone, with multiple red markers suggesting downside continuation risk is still high.
Scenarios to Watch
Bullish Scenario
* Price holds $420 and forms a higher low.
* Breakout above $440 opens door to $457 → $475 zone.
* Risk-on confirmation if we reclaim $457 with strong volume.
Bearish Scenario
* Breakdown below $420 = major flush trigger.
* Price could cascade to $405–$400 near previous fair value gaps.
* Put support levels are likely to absorb some of the sell-off, but sentiment is fragile.
Final Thoughts
This is a high-volatility week. Institutions are hedging heavily. Don’t fight the trend—watch for clear reclaim above $440 to go long. Otherwise, trade level to level and protect your capital.
QQQ is not yet safe for investment—wait for reclaim above $457 and improving options sentiment before considering entries. For traders, short-term scalps off $420 with tight risk management are in play, but be prepared for violent swings.
This analysis is for educational purposes only and does not constitute financial advice. Always do your own research and trade responsibly.

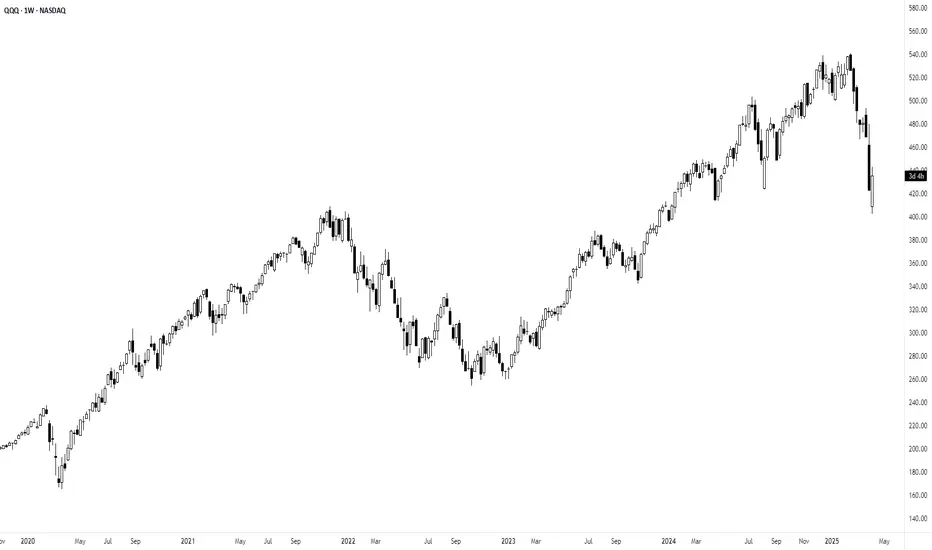
QQQ Selling Just StartingIf you have any illusions this will be a buy-the-dip market, you are taking on a major risk!
1. Last time QQQ sold off it lost 84%
2. It took 17 years to break even
3. It took much longer to break even inflation-adjusted
You can't buy low if you don't sell first. You don't have infinite money.
WARNING!

$QQQ Has Officially Entered a Bear Market $SPX is CloseNASDAQ HAS OFFICIALLY ENTERED A BEAR MARKET, DOWN ~22%
NASDAQ:QQQ 2022 Bear Market bottomed ~37%
just below the 200WMA
S&P 500 is not quite there yet, down only ~17.5%
SP:SPX 2022 Bear Market bottomed ~27% a tick below the 200WMA

QQQ fibonacci retracementsThis is the QQQ and Fibonacci retracements from 2022 and 2020 to give you an idea of where support may lie. We crashed through support and sit in open air.
Nasdaq 100, QQQ expected to bounce from hereQQQ reached equal legs perfectly friday and is now expected to bounce monday to regain 50% of the decline from ATH. Then another leg to reach the long time trendline and volume support is expected.

How bad will it get? Let's talk about it!🌟 My Market Probabilities: 🌟
1⃣ 15% chance of a V-Shape recovery with a bottom at $410–$425
2⃣ 45% chance of a COVID-like Flash Crash resolving at
$385–$400
3⃣ 33% chance of a 2022-level bear market down to
$330–$350
4⃣ 5% chance of a 2008-level crash hitting $250–$260
5⃣ 2% chance of a crazy Dot.com-level crash dropping to $90–$110
💡 No matter which scenario unfolds, it’s a blessing in disguise! These dips create incredible opportunities to invest in great companies or indexes like the AMEX:SPY or NASDAQ:QQQ paving the way for massive, life-changing wealth over the years and decades to come.
🚀 Think long-term as an investor, friends, and stay focused on the bigger picture!

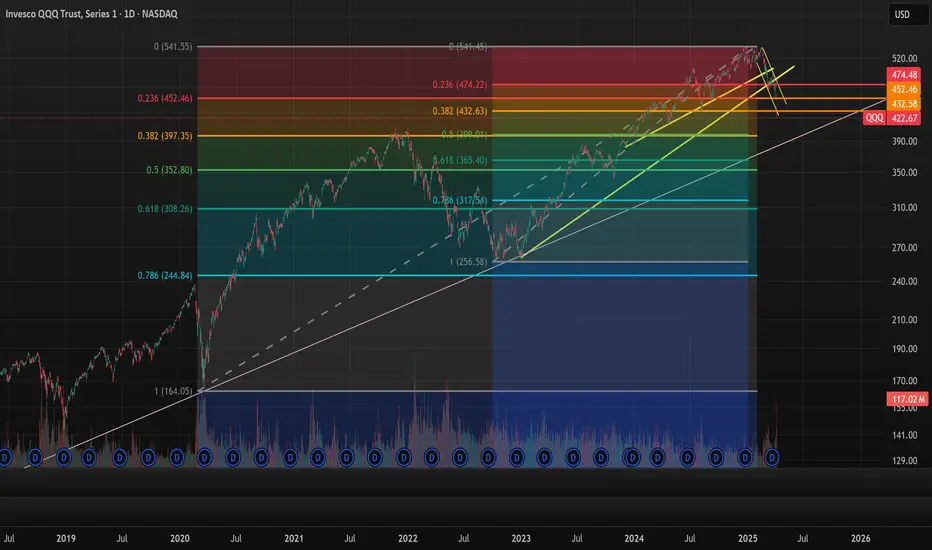
QQQ Stock Chart Fibonacci Analysis 040525Trading Idea
1) Find a FIBO slingshot
2) Check FIBO 61.80% level
3) Entry Point > 423/61.80%
Chart time frame: B
A) 15 min(1W-3M)
B) 1 hr(3M-6M)
C) 4 hr(6M-1year)
D) 1 day(1-3years)
Stock progress: C
A) Keep rising over 61.80% resistance
B) 61.80% resistance
C) 61.80% support
D) Hit the bottom
E) Hit the top
Stocks rise as they rise from support and fall from resistance. Our goal is to find a low support point and enter. It can be referred to as buying at the pullback point. The pullback point can be found with a Fibonacci extension of 61.80%. This is a step to find entry level. 1) Find a triangle (Fibonacci Speed Fan Line) that connects the high (resistance) and low (support) points of the stock in progress, where it is continuously expressed as a Slingshot, 2) and create a Fibonacci extension level for the first rising wave from the start point of slingshot pattern.
When the current price goes over 61.80% level , that can be a good entry point, especially if the SMA 100 and 200 curves are gathered together at 61.80%, it is a very good entry point.
As a great help, tradingview provides these Fibonacci speed fan lines and extension levels with ease. So if you use the Fibonacci fan line, the extension level, and the SMA 100/200 curve well, you can find an entry point for the stock market. At least you have to enter at this low point to avoid trading failure, and if you are skilled at entering this low point, with fibonacci6180 technique, your reading skill to chart will be greatly improved.
If you want to do day trading, please set the time frame to 5 minutes or 15 minutes, and you will see many of the low point of rising stocks.
If want to prefer long term range trading, you can set the time frame to 1 hr or 1 day.
