Quantum Race: Who Will Become the “NVIDIA” of the Quantum Era?Quantum Computing Race: Who Will Become the “NVIDIA” of the Quantum Era?
As the quantum computing sector accelerates, companies like D-Wave Systems, Rigetti Computing, Quantum Computing Inc. (QUBT), and IonQ are emerging as key players—each competing to become the dominant force in what could be the next trillion-dollar tech frontier. The comparison to NVIDIA in the AI and GPU revolution is no longer far-fetched, as these firms race to define the future of computing.
Despite their different technological paths—D-Wave with quantum annealing, Rigetti with superconducting qubits, IonQ with trapped-ion systems, and QUBT with hybrid quantum-classical platforms—these companies are now tightly interlinked in market perception. A strong earnings report, product milestone, or government contract from one often fuels sector-wide hype, lifting stock prices and investor sentiment across the board.
This mutual influence is driven by the belief that success by one player helps validate the entire industry. In that sense, these firms are collaborative competitors, pushing the space forward while fighting for leadership. Quantum computing is still in a developmental phase, but the potential is massive—targeting breakthroughs in AI, cybersecurity, materials science, finance, and more.
With analysts forecasting the global quantum computing market to exceed $1 trillion by 2035, the question is no longer if the sector will explode, but who will lead it.
For now, no clear winner has emerged, but momentum is building. And in this space, a breakthrough by one can ignite a rally for all—making the quantum sector one of the most exciting and interconnected areas in tech today.
QUBT trade ideas


QUBT Bullseye: $20 Taget in Sight! Welcome to Odins Trading Den!
QUBT Bullish Outlook: Targeting $20 in the Coming Weeks
QUBT is showing strong bullish potential on the daily chart, with a clear setup pointing to a move toward the $20 range in the next few weeks. My analysis highlights a bullseye target at $20, supported by key technical indicators and price action:
Breakout Momentum: QUBT has recently broken above key resistance levels, signaling strong buying interest and potential for continued upside.
Volume Surge: Increasing trading volume supports the bullish move, indicating growing market confidence.
Technical Patterns: The chart shows a bullish consolidation pattern, with price action tightening before an expected upward breakout.
Target Zone: The $20 level aligns with historical resistance and Fibonacci extension levels, making it a realistic target for this move.
Check the chart for the bullseye marking the $20 target. This setup suggests a strong risk-reward opportunity for traders. Always manage risk and stay updated with market conditions.
What are your thoughts on QUBT's potential? Let’s discuss below!

QUBT LONGFollowing the strong quantum theme. Lice breakout with volume while spy weakening. $18-$21 targets.

QUBT Ready For LiftoffQUBT also known as Quantum Computing Inc is an innovative, integrated photonics company that provides accessible and affordable quantum machines to the world today.
Given the potential and scale for AI technology, Quantum computers may become more in demand to process and support the future of the AI boom.
At the moment, we are seeing quite a bit of strength coming into this stock given the surprise of 250% on earnings this week, a massive 10x increase from their previous averages.
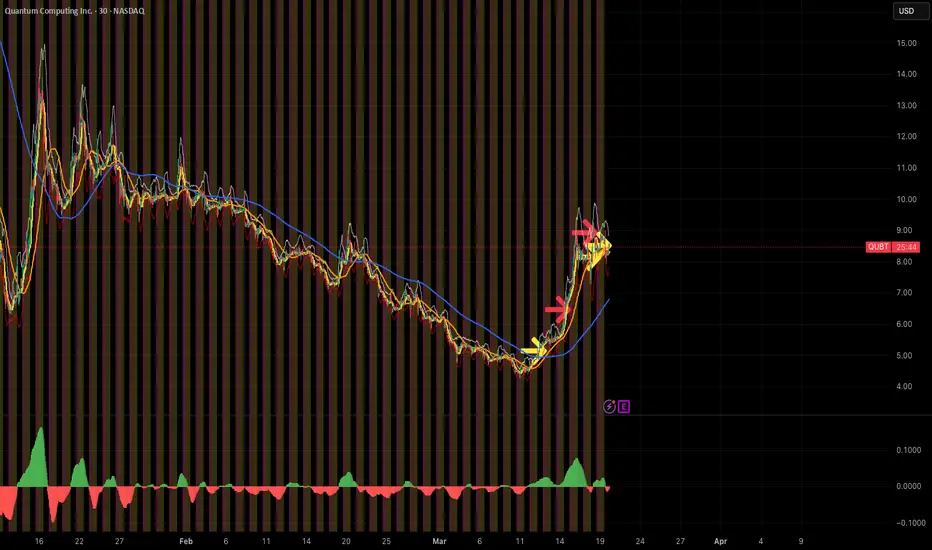
Technically, we are seeing price rise above the downtrend VWAP (Volume weighted Average Price) which is a significant resistance for the current downtrend. Given the current strength, I am interested in further upside, potentially back to the ATH which can happen quite quickly given how this stock moves in large impulses.
The MACD is currently starting to curl to the upside as well after a recent cross, signalling that momentum is beggining to shift to the upside.
For an ideal entry, you can wait for the VWAP to be backtested as an ideal entry at support around 11.85. Should we drop further to the 10.85 earnings gap, this would be a great area to compound the long trade for the reversal.

QUBT watch $8.64/75: Key Resistance after quantum sector rallyQUBT rallied with all quantums, into a serious resistance.
Looking for a Dip to Buy or a Break-n-Retest entry for longs.
Some companies are apparently close to commercial usage.
$8.64-8.75 is the exact zone of interest.
$9.36 would be first target for a breakout.
$8.16 then 7.65 are supports below if needed.
====================================================
.

quantum tech. bullish earnings the only reason I will be longing hundreds of contracts on this earnings report is due to their new plant in AZ, which opened in march. They should report better EPS then expected. not much to it

5/14/25 - $qubt - lol5/14/25 :: VROCKSTAR :: NASDAQ:QUBT
lol
- a billion dollar market cap
- that's the product, as i can tell
- even meme coins don't burn your cash
- i'm proactively shorting this into results, and will double or triple my size if the reaction is a massive spike - i actually welcome it. reality it, it's such an obvious donut at this point, i almost can't help myself.
- if you can offer anything logical in the comments worth responding to, i'll gladly engage and politely
- but if you're going to troll me, i don't need do more than just wait it out and i won't even say "scoreboard" at the end of this all. that would just be mean and it's not my nature.
- just be careful if u own this, k?
V

5/23/25 - $qubt - 1000x sales for a fake company?5/23/25 :: VROCKSTAR :: NASDAQ:QUBT
1000x sales for a fake company?
- what could go wrong?
- this one is the most squeezable, mainly bc it's such a "tiny" market cap of $2 bn vs. the other ""quantum"" names.
- with that being said, this is not a real company
- i welcome this thing ape'ing higher. it's already 3% short, but i'd *love* to take it to 10%.
- currently have a 20% sector short on leverage w/ long dated exposure
- play carefully
- but i've never seen a more obvious sector short in my life
V

QUBT – Symmetrical Triangle Breakout Setup with 32% PotentialQuantum Computing Inc (QUBT) is forming a symmetrical triangle on the 15-minute chart. The price just bounced off the lower trendline at $7.59, and the projected move could reach $10.04, offering a +32% upside.
Technical Highlights:
• Triangle Pattern: Clear structure with lower highs and higher lows.
• Support Bounce: Strong reaction from $7.59 (triangle base).
• RSI: Rebounding from mid-range (currently 50–57), signaling strength.
• MACD: Preparing for a bullish crossover.
• Volume: Healthy increase near support area.
Bullish Scenario:
A confirmed breakout above the upper boundary (~$8.20) with volume could trigger a strong move towards the measured target at $10.04.
Stop Loss:
Below $7.50 for conservative risk management.
⸻
Disclaimer:
This analysis is for educational purposes only. It is not financial advice. Please do your own research before making any investment decisions.

QUBT Bullish Breakout Setup !📊 Trendline Respect + Momentum Shift 🚀
This chart shows a bullish wedge breakout forming above a strong ascending trendline, holding above key structure levels. Buyers are defending support and building pressure for a breakout.
✅ Trade Plan (Long Position)
• Entry: Above $7.88 (breakout confirmation)
• Stop-Loss: Below $7.37 (trendline + support zone)
🎯 Take Profit Targets:
• TP1: $8.73 (near-term resistance zone)
• TP2: $9.78 (major breakout level)
• TP3: $11.00+ (extended upside potential)
📈 Risk-Reward Insights
• Risk: $7.88 - $7.37 = $0.51
• Reward to TP1: $0.85 → ~1:1.6
• Reward to TP2: $1.90 → ~1:3.7
• Reward to TP3: $3.12 → ~1:6.1
💡 Strong R:R profile with clean structure and solid confluence.
🔍 Technical Breakdown
✅ Trendline Support: Strong multi-touch uptrend line
✅ Wedge Breakout: Symmetrical triangle breakout forming
✅ Volume: Volume surge on breakout confirms strength
✅ Structure: Higher lows forming under resistance – bullish bias
🧠 Strategy & Risk Management
• Entry Only on Breakout: Wait for a 30-min close above $7.88
• SL to Break-even after TP1 ($8.73)
• Partial Profit Booking Strategy:
• Book 50% at TP1
• Ride remainder toward TP2 & TP3
• Trail Stop: Protect gains as price moves in your favor
📚 Value Insight for Traders
This setup teaches how trendline respect, consolidation, and volume align to create powerful breakouts. When price forms a tight range above a rising base, it's a sign of accumulation, not weakness. Let the breakout come to you.
⚠️ Risk Reminders
❌ Fake Breakout Risk – Exit early if price closes back below $7.88
❌ Volume Drop – A weak breakout with low volume may fail
✅ Stay mechanical, not emotional
🎯 Final Thoughts:
One quality setup > 10 random trades.
High-probability setup. Risk managed. Plan ready.
📈 Trade smart, trust the process, and let price action lead the way.
🔗 #QUBT #StockSetup #TradingView #BreakoutSetup #ProfittoPath #BullishChart #SwingTrade #TechnicalAnalysis #SmartTrading #MomentumTrade 💰📊

QUBT.....nice upside Quant ComputingTechnicals and fundamentals seem to check out on this one as well as recent spikes. Already cleared multiple profits on QUBT. Still a good price to get in IMHO! Will start spiking real soon...
Best of luck and always do your own due diligence!

QUBT....early Xmas giftI have a feeling that we are going to have an early Xmas gift with QUBT! History repeats itself and this seems like a great price to get into. Within a few days it's positioned to spike around the $15-20 target price range. I've already taken several profit positions with this stock.
Best of luck and always do your own due diligence!

QUBT screaming to get to $11This stock is just a darling, spiking so much and itching to get to $10-11 and it's a sweet price atm. Technicals check and nice history of spiking super high. Loving it!
Best of luck and always do your own due diligence!
Short Squeeze....QUBTLooks like a classic short squeeze! Don't touch it until it drops to a sensible level and pick up the rebound. Made some good wins with this baby! Keep it coming, but be super careful....
Best of luck and always do your own due diligence!

QUBT consolidation....to fly to $10 and beyondGreat little set-up, QUBT has been very good and nicely set-up to consolidate and go to the next level $10 - 12 range. There could be some volatility, but looking sweet!
Best of luck and always do your own DD!

QUBT great stock after reboundThis is a nice little nugget I found and sharing it! Already made over 15% on this one. Wait for the rebound and pick it up again, I'll drop more technicals once it starts picking up. Set up your alerts asap!!!
Best of luck and always do your own due diligence!
QUBT Long Potential Reversal from Demand ZoneThe Quantum Computing Inc. (QUBT) stock has retraced to a 15min demand zone after a strong rally. With confluences from RSI, volume profile, and order blocks, a reversal seems plausible.
Strategy: Look for bullish confirmation (e.g., break above $10.70 or crossing the trend line before entering the trade.
Trade Plan:
Entry: ~$10.60
Stop Loss: $10.12
Take Profit: $13.44
Position Size: Adjust based on risk tolerance, ensuring 1% account risk per trade.
(RRR): Approximately 1:6,
Risk Management:
If the price closes below the demand zone ($10.05), then avoid entering the trade if bearish momentum increases below $10.05
Trade Advice:
Plan Your Trade:
Define your entry, stop loss, and target levels before placing the trade.
Stick to your risk management plan, risking no more than 1-2% of your account per trade.
Wait for Confirmation:
Look for additional confirmation signals (e.g., a bullish candle pattern or a surge in volume) before entering the trade.
Set Alerts:
Use alerts to monitor key levels like $10.50 (for potential entry) and $10.01 (for stop loss).
Be Prepared for Volatility:
Stocks like QUBT may experience sudden price swings. Use appropriate position sizing and avoid overleveraging.
Review and Learn:
Analyze the trade outcome, whether successful or not, to identify lessons for future setups.
"Trading requires patience, discipline, and a solid understanding of risk management. Never trade with money you cannot afford to lose."

QUBT about to plummetAfter quantum pump it’s time to pick these apart the only quantum’s worth keeping are RGTI IONQ D-wave. This company has no revenue basically a shell company considering $5 4/17 P

QUBT: CAN U SHORT OR JUST WAIT FOR FAIR PRICEHi guys, every time is the same story.
Following mega announcement some company rise up up to 4.000%, then retrace about 40% and start again to rally, but is this a real rally?
Based on my experience and many other companies that did the same, not it's not.
We would probably see a huge retracement until the gap and maybe it can go deeper.
I could short it, but I prefer wait and buy cheap stock for long term.
Let' see.

BUY QUBT PUTS NOWWWW!!!!The quantum computing hype is real. Incredible short term gains and incredible mid to long term risk. Companies such as NASDAQ:RGTI and NYSE:IONQ have promising technological/industrial prospects that justify the excitement but NASDAQ:QUBT Quantum Computing Inc. is not one of those companies. They are not a quantum computing company as the name suggests. The same entity has changed their "business model" multiple times with each coming trend to no success. Before quantum computing they were involved with beverage distribution as "Innovative Beverage Group Holding, Inc.", selling printer ink, and they made a brief attempt at AI.
Notes :
- Iceberg Research discovered that the foundry Quantum Computing Inc. listed on their website and cited in a press release was actually just a small office building clearly incapable of producing TFLN wafers (or any sort of mass production for that matter).
"In September 2023, QUBT told investors that the location for its “new facility is on five acres within the extensive 320-acre research park hosted by ASU”. However, the entire entire 2050 building is barely more than an acre, let alone Suite 107 in the building. At that time, production was supposed to start in the first half of 2024."
I encourage you to read the full report (link below).
- QUBT's revenue for 2024 was only $300K. Their market cap is currently $1.5 Billion.
Technical Analysis
While the fundamental analysis was enough to convince me to enter a put position, the TA is also promising. The "pump" caused by recent quantum computing hype is not the only pump and dump in QUBTs recent history. There are two very similar patters that have occurred since Jan 2018.
Interestingly, the 50 SMA crossing above the 200 SMA on the weekly timeframe has signaled the peak of both movements. As for the current movement, the SMAs are expected to cross by next week at the latest.
As you can see in the chart, the cross (and peak) are followed by a drastic rejection and then a retracement to the 38.2 fib level. As of today, price is currently between the 50 and 38.2 retracement levels.
In the short term, it is possible that price will enter the volume gap created on 08 Jan and potentially fill up to $16.25. This break above the 38.2 fib level will be of key interest to anyone seeking entry into a short or put position. As you can see in the 2021 movement, price did indeed break above the level, fell short of retesting highs, and initiated a reversal and 78% drop. Only after this did QUBT retest and reject off of the 38.2 fib level and proceed to drop another 86%.
iceberg-research.com
www.globenewswire.com

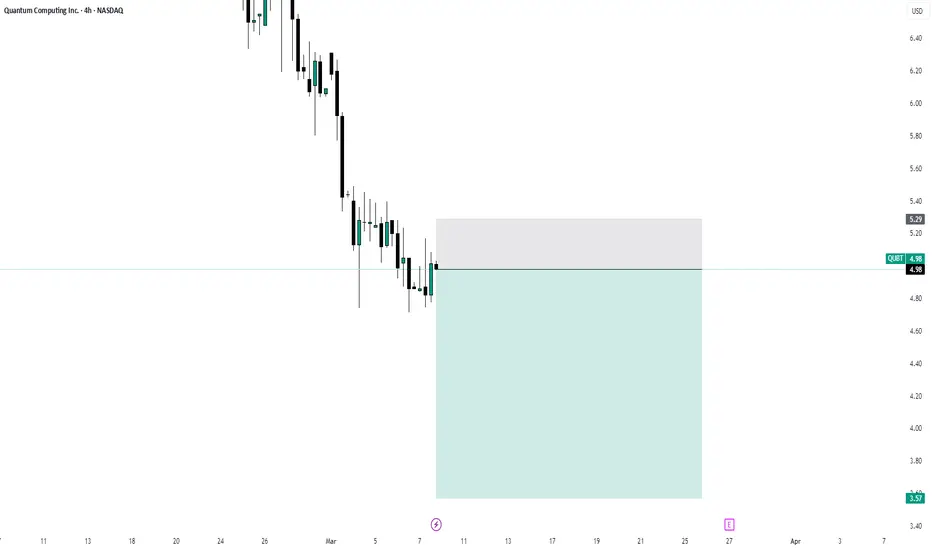
KEEP TRADING SIMPLE - QUBTExhausted Motive - Rising Volume - Bottom - Take advantage of possible corrective action.
Have a great day!
