RCL trade ideas


Year end goal for Royal Caribbean CruisesOnce the dark cloud of the virus passes, we should start to see this trending up quite a bit.

All Cruise Lines Way Oversold The biggest factor during the coronavirus selloff is the lack of information. The market hates uncertainty. For obvious reasons the travel sector has been hit the hardest, especially the cruise line industry. IF YOU ARE YOUNG now is the best time to buy. If you are between the age of 18 and 40 this is most likely the best opportunity that we will have at the market before it recovers. The cruise line industry will most likely recover by the end of the year. The industry as a whole has taken a 75% hit on average. These levels will most likely return by years end, giving us a 300% return on investment. It may take one or two months, it may take six, hell, it might take a year or two even. Realistically speaking, this market will recover These cruise lines are starting to reach massive support giving us a great opportunity to buy at a massive discount. IF YOU ARE WILLING TO BE PATIENT, buy up the cruise line stocks and dollar cost average in as these hit lower lows and allow your investments to sit as long as it needs to recover at previous levels. I can't imagine it taking more than three years, three months at the least.

FIRST DIP INTO TOP 3 LINERS Took my first dip into the Cruise companies sticking with the top players and the one that just secured liquidity facilities yesterday , also expect the US government support for these too
Any positive news can double your investment in no time , otherwise good LT holdings if don't go into bankruptcy of Course lolll
Took equal weight each , will add if situation improve, this is a first dip so go nimble if you play that game like me
CCL
RCL
NCHL


$RCL Possible selling climax$RCL at highly negotiated level of volume. Monthly chart. Huge increase in volume yesterday with a hummer candle (take a look at daily chart) that could be indicating a possible selling climax or the buys by institutional investors. If this level does not hold, the next to look is around $26.

$55 or $27?With a PE of 5.78 I'd like to think that the $55 range would become a strong level of support. However, strictly from a chart perspective the next level would be $27. I had to pull back to the 1990's to find that one.
Up until the panic of COVID-19 this was a solid company financially with year over year growth. If COVID-19 is a short term problem then this is a fantastic time to be a buyer to hold in the long term.


Virus News insurance tradeWith the market in a rout and COVID-19 at large, the last place anyone wants to be is stuck on a cruise ship. Company seems fundamentally sound but this fear over a 'pending pandemic' will sent this thing into the ground. Buying a small position in OTM 60$ 3/13 or 3/20 puts tomorrow morning at the 65 or 60 mark. Hopefully the news that cruise ships in the Caribbean are getting turned away from ports doesn't hit headlines before then.
trade at own risk*

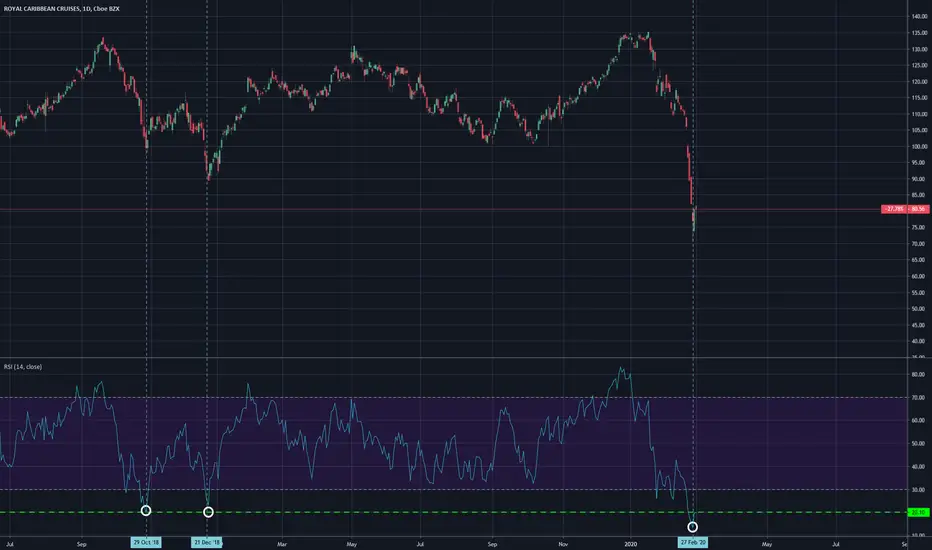
Support holding, but temporaryHi guys,
I noticed some support and resistance areas, along with a nice bounce off of the old trend line. If we move sideways and end up breaking through this support on the trend line, I would probably exit the trade and cut losses. I expect some rebound for a short period of time since the RSI is so incredibly oversold. Happy trading!

Royal Caribbean Cruises could be great Long Term $rcl
It may be dumpster diving, but one mans rubbish can be another mans treasure.
Currently trading at a 50% discount from 2020 highs.
Possible that these companies get government assistance short term, as they are a major employer.
Company profile
Royal Caribbean Cruises Ltd. operates as a global cruise vacation company. It operates global cruise brands: Royal Caribbean International, Celebrity Cruises, Azamara and Silversea Cruises. The firm also holds interest in TUI Cruises, Pullmantur and SkySea Cruises brands. The company was founded in 1968 and is headquartered in Miami, FL

Royal Caribbean will Fall as well...Corona!!Royal has a little more to drop...Then lets have a party

Cruise Liner Contrarian - RCLFeels like a massive overreaction, RSI more extreme than the previous 2 occurances and so is the downwards price action.
Looking for a sharp rebound.


$RCL at R/S flip$RCL (Royal Caribbean Cruises Ltd) testing this R/S flip with a remarkable increase in volume. 4h chart

Royal Caribbean BreakoutMonthly chart/ Royal Caribbean Breakout
Disclaimer:
We are not registered or licensed in any jurisdiction whatsoever to provide investing advice or anything of an advisory or consultancy nature,
and are therefore are unqualified to give investment recommendations.
Always do your own research and consult with a licensed investment professional before investing.
This communication is never to be used as the basis of making investment decisions, and it is for entertainment purposes only.

RCL Put SpreadDebit Spread on RCL $3.52 Max gain is 11.48
My max loss will be $1.8 at August 30th if the play doesn't work out.
I got a ton of earnings plays on I'm probably going to get burned a bit we'll see how it pans out.
EXP September 20th.
Medium Risk, Medium Reward
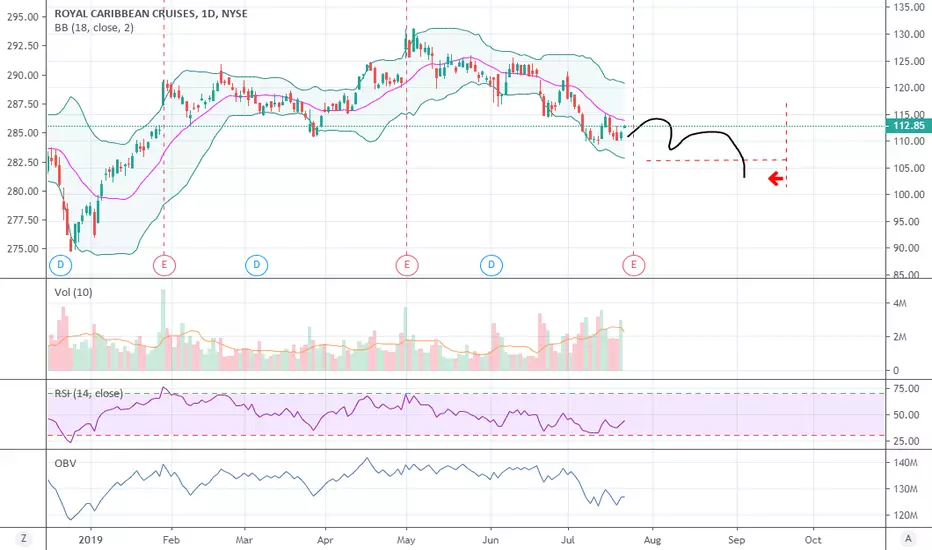
RCL - Bull Put Credit SpreadStrong PA sell off last few days to Low BB%
RSI Oversold
S&R Level at 110 Previous Level so looking for consolodation and then reversal to mean back higher.
Aiming for 110/105 Put Credit & 115 Call option for Directional bias higher.
Exp Aug 16.
Good Luck - Watch YOUR RISK.

still bearishrcl had a breaking of the supporting trendline but then provided a pullback once it hit the 200dayMA and also formed a stronger support trendline from where it bounced. so right now it is in the middle of two trendlines and also in the pullback phase. it might have formed a mini flag when it jumped back up and consolidated. so i will be looking for a minor pinch up then after that if it doesnt break the resistance trend line then i will short it if it signals. EX: high volume going down, breaking of the support trendline, breaking of 200dayMA, breaking of previous low

looking very bearishRight now we are looking at a potential triple top, we wont know until it breaks the resistance, what i believe to be the 100 dollar mark as it bounced off it before the last dip. But along with that we have a rising wedge while the trend of the stock itself is going down, making a flag/pennant formation. We have not made a new high in a year and a half, and each dip thereafter has be repeatedly lower. The volume itself was strong on the breaking of the wedge, but be prepared for a pullback as it hit the 200dayMA and as the market itself is pinching the last of the bull market out, then be prepared to sell for a big drop.

RCL - Bull Put Credit SpreadMini A-B-C-D down to Lower BB. RSI Oversold. Price at key MA.
Looking for Reversal to Mean, back Higher.
Aiming for 116/114 Bull Put Credit & Call Options for Direction Higher.
Exp June 21.
Good Luck - Watch YOUR RISK.
