$RIOT / 2hThere is no change in my NASDAQ:RIOT 's analysis. The rising leading diagonal ended with an ending diagonal inside!!
Trend Analysis >> Respecting the wave structure of the leading diagonal in which the 5th wave has revealed an ending diagonal and decline by 12% since the May high, all quite well indicate that the anticipated correcting down should be a relatively deep retracement. And it will take the coming few weeks.
The first retracement target >> 7.68
#CryptoStocks #RIOT #BTCMining #Bitcoin #BTC
RIOT trade ideas

RIOT / 2hNASDAQ:RIOT
The rising leading diagonal quite well ended with an ending diagonal inside!!
Trend Analysis >> Considering the wave structure and closing the week with an 11% decline suggests that an expected relatively deep correction should have begun its way down toward the Fib-retracement levels. It will take a few coming weeks.
The first retracement target >> 7.68
#CryptoStocks #RIOT #BTCMining #Bitcoin #BTC

RIOT / 2hNASDAQ:RIOT may have started an a-b-c correction in a possible expanded flat since the
mid-May high >> 9.47. So, respect to the wave structure suggests that it should not be a deep retracement.
The first Fib-retracement target >> 8.05
#CryptoStocks #RIOT #BTCMining #Bitcoin #BTC

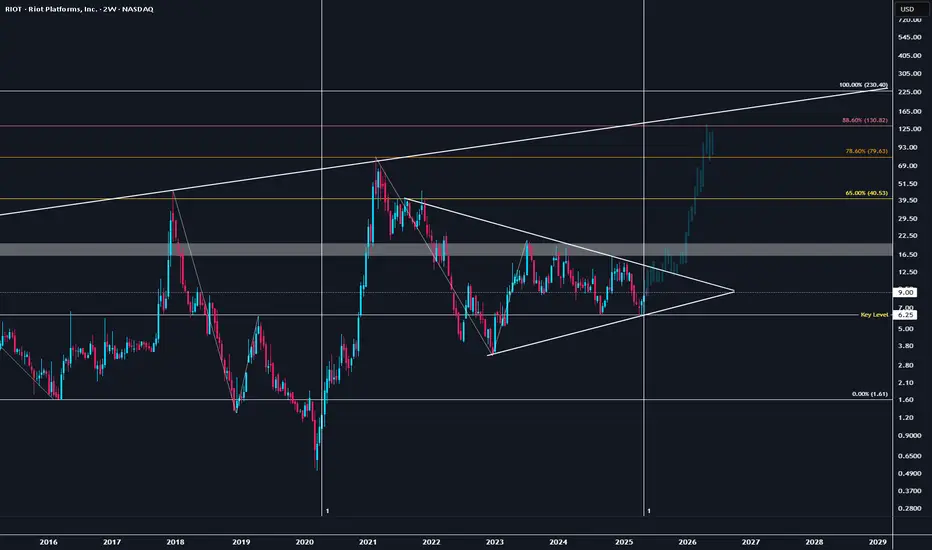
RIOT: The Sleeper Trade to $130📈 RIOT to $130? The Bull Case Is Heating Up
RIOT Platforms is primed for a major breakout — multi-year triangle compression on the weekly, identical to its 2020 setup before a 35x move. We’re now approaching the 1:1 time Fib window (2021 top → 2022 bottom → 2023 echo high), the same cycle structure that triggered the last parabolic rally.
BTC at $111K, eyeing $160K. History says miners lag then explode. RIOT gained 35x in the last BTC breakout — this cycle could easily echo that with a $130 target (0.886, last cycle price hit the 0.786, prior to that, the 0.65 so the logical next target is the 0.886
Fundamentals are locked in:
⚡️ Hash rate: 33.7 EH/s
🧱 Producing 500+ BTC/month
🧮 Cost per BTC: ~$44K → profit margins >70% at $160K BTC
💰 Treasury: 19,000+ BTC (~$2B)
🏭 New Corsicana site online, scalable beyond 35 EH/s
Sentiment setup is explosive:
🔥 High short interest = squeeze fuel
🔁 Chart reclaiming macro trendline + coiled tight
🧠 Retail and institutional flows rotating into miners
Cycle symmetry. BTC tailwind. High-beta name with short squeeze potential. Riot’s $130 move is technically, fundamentally, and psychologically primed.
#RIOT #Bitcoin #BTC #CryptoMiners #Breakout #Compression #BullRun
RIOT / 2hNASDAQ:RIOT should have completed the leading diagonal pattern at the mid-May high >> 9.47, and holding the price under that this week. Also, it seems to have posed a further decline toward the Fib-retracement level of 0.618. The first target >> 7.28
Trend Analysis >> The Minuette degree trend should have turned downward. And it would likely be a relatively deep correction which takes a few weeks.
#CryptoStocks #RIOT #BTCMining #Bitcoin #BTC

RIOT / 2hNASDAQ:RIOT may have completed the leading diagonal pattern at 9.47. So, the correction could have begun its way down toward the Fib-retracement levels, as depicted in the chart above.
#CryptoStocks #RIOT #BTCMining #Bitcoin #BTC

RIOT Compression Breakout to $10
⸻
TradingView Summary – RIOT Platforms, Inc. (Ticker: RIOT)
Current Price: $8.82 | Timeframes: 1H / 4H / 1D
Bias: Bullish toward $9.90–$10.12 zone
⸻
Trade Thesis:
The “RIOT Compression Breakout to $10” setup is based on multi-timeframe alignment showing bullish structure, fair value gap fills, and a coiled price pattern just beneath key resistance. RIOT has reclaimed a critical level ($8.80), suggesting a setup for breakout toward stacked liquidity between $9.90 and $10.12.
⸻
Technical Justification:
1H / 4H:
• Filled FVGs between $8.60–$9.11 suggest recent accumulation.
• Bullish Order Blocks provide layered support from recent demand.
• Compression below resistance ($9.11) indicates a pressure build toward breakout.
• Volume Clusters show declining sell-side volume as price holds above $8.80.
1D (Macro Context):
• Daily uptrend with higher lows and bullish candle structure.
• Reclaim of $8.80 confirms prior resistance flipped to support.
• Clear breakout targets at $9.90 (liquidity) and $10.12 (imbalance fill).
⸻
Key Levels:
Type Price
Entry Support $8.80
Pivot Breakout $9.11
Target 1 $9.90
Target 2 $10.12
Invalidation < $8.50
⸻
Trade Logic:
Hold above $8.80 confirms bullish bias. Break and close above $9.11 on volume opens the path toward $9.90–$10.12. Failure to hold above $8.50 invalidates the setup.
⸻
Disclaimer: Not financial or legal advice. For educational purposes only. Conduct your own due diligence before investing.

RIOT / 2hNASDAQ:RIOT reached both diagonals' lower boundary line, as expected in my prior analysis.
The ending diagonal inside the leading diagonal remains in a very late stage. An ultimate advance of 8% lies ahead. It would be before the following deep correction towards the Fib-retracement levels >> 7.19 >> 6.74, as illustrated in the chart above.
Wave Analysis >> The diagonal wave v can not exceed 9.70 because the length of wave v can not be longer than wave iii, which can not be the shortest upward in the 5-wave sequence.
The Ultimate Target >> 9.70
#CryptoStocks #RIOT #BTCMining #Bitcoin #BTC

RIOT / 2hNASDAQ:RIOT continued to advance 5% today, suggesting that an analysis that considers an ending diagonal as wave v inside the leading diagonal in which the last subdivision has remained in the late stage should be respected.
Wave Analysis >> The diagonal wave v can not arise beyond 9.70 because the length of wave v can not be longer than wave iii, which can not be the shortest wave upward in a 5-wave sequence.
The Ultimate Target >> 9.70
#CryptoStocks #RIOT #BTCMining #Bitcoin #BTC

RIOT: Not really keeping up with Bitcoin.While BTC is pushing into January highs, RIOT and other miners are still far off from their respective January tops. RIOT had a fine move off the April lows but May started to get choppy. It is not a good sign if Miners are hitting a wall while BTC is ripping. So, at this point the best bullish case for RIOT is a leading diagonal structure. Right now, BTC, NDX etc. are looking to coming up on a local top. RIOT should also see a little bit higher price and then get ready for a correction. This is when the true test of bull market will take place. Both BTC and RIOT should form some kind of an inverted head and shoulders pattern. In that case the correction should last for a couple of weeks to a month or so and create a higher low. We do not want to see RIOT dipping below $6.96. I am out in the sidelines at the moment. I will start to buy in again at around $7.9- $7.5 support area. Hopefully the gap close and then ready to rip. If price is in fact on wave 3, then the move up should be in clean 5 waves up, 3 down formation and with very strong impulse. Initial targets will be a test of the top side of the channel. Below $6.96, things will start to fall apart for bullish story.

RIOT / 2hNASDAQ:RIOT
The rising diagonal may have thoroughly ended at the Monday high>> 9.12.
Hence, turning to a deep correction downward is now expected.
The Fib-retracment targets >> 7.19 >> 6.74

RIOT / 4hNASDAQ:RIOT has risen well with a leading diagonal, which developed since the mid-April low at 6.19.
After an expected 4.14% advance today, expect now to continue to rise >> just 7% tomorrow. And it would be prior to the correction of the rising tide diagonal.
Target >> 9.72
#CryptoStocks #RIOT #BTCMining #Bitcoin #BTC

RIOT / 3hNASDAQ:RIOT has risen well with a leading diagonal which developed since the mid-April low at 6.19. The diagonal should be in a very late stage, and expect to continue to advance >> 11% likely tomorrow.
#CryptoStocks #RIOT #BTCMining #Bitcoin #BTC

Double bottom and Demand on RIOT! OptionsMastery:
🔉Sound on!🔉
📣Make sure to watch fullscreen!📣
Thank you as always for watching my videos. I hope that you learned something very educational! Please feel free to like, share, and comment on this post. Remember only risk what you are willing to lose. Trading is very risky but it can change your life!

Riot to 6.84RIOT Platforms, Inc. is showing signs of a potential retracement after a strong rejection from the $8.15–$8.18 resistance zone. The long upper wick and red daily candle suggest sellers are stepping in. Price has re-entered a Fair Value Gap (FVG), and I anticipate that imbalance to get filled.
The $6.84 level is a key support zone from previous structure and coincides with the lower boundary of the last bullish impulse. It’s also where multiple wicks formed on high volume, indicating liquidity and buyer interest.
Trade Setup:
• Entry: $7.83 (current level)
• Target: $6.84
• Stop Loss: $8.35 (above rejection wick)
• Risk/Reward: ~1.5R
Thesis:
Price likely revisits $6.84 to fill the FVG before any bullish continuation.
What Invalidates This Trade:
• A strong daily close above $8.40
• Bullish engulfing candle reclaiming $8.18 with volume
• Bitcoin making a new high and dragging crypto-related stocks up with it
Key Metrics to Monitor:
• Daily volume spike above average on green candles
• Bitcoin spot price above $67,000 (macro correlation)
• RSI breaching 60 with bullish divergence
• Reclaim of 21 EMA on the daily
⸻
Disclaimer:
This is not financial advice. These are my personal opinions and ideas based on chart analysis. I’m not a financial advisor. Always do your own due diligence and consult a licensed professional before making any investment or trading decisions.

RIOT: Double bottom to the moon or false break nosedive?The move up today looks very encouraging, but we only have a 3 waves move so far. Price broke above $7.39, which is a good sign, a higher high. Now price needs to stay above $6.67 and complete a full 5 waves sequence. Even then, the danger might not be over until price breaks above $8.24 and better yet, above $8.86. I will be ready to get my bag filled on wave 2 retrace and will have stop loss at the last low. If we don't see price making another high before the retrace, chances are RIOT will go lower one last time. At the moment, crypto market overall seems to be on a rebound. Has the mighty bull market started? We will find out soon enough!
I am following M2 money supply chart closely. There are some very intriguing analyses out there on correlation between M2 global money supply and total crypto market cap. Fundamentally, it makes a lot of sense. And if BTC rebounds, RIOT and other miners will rebound stonger. Recently, the Gold bull run has made GDX spike higher (almost 33% for gold this year compared to almost 60% for GDX). If GDX breaks to all time high, that will be an extreme move by the miners. If RIOT and other big BTC miners see similar move against BTC, it will be multiple times gains. Not trying to bet on something theoretical, but if it plays out, it will make a lot of very rich holders...

RIOT: A less severe crash countThis is my less severe crash idea. We should get one more lower low in this count to close out Wave 2 of the intermediate degree. The low of $6.22 is not very clean and the recovery since then is also quite choppy, suggesting a final flush out. My previous count expects a worse case. This one is a bit more hopium induced. If I am totally wrong and the long-term wave 3 already started, then we need to see a very strong move out of the steeper channel and a quick ride to the upper limit of the bigger channel, and a break above that. Until then, looking to buy at the next low with stop loss again and continue that process until we eventually get a low. Stop loss is very important to preserve capital, in case things are really going to zero (as many are suggesting; not me). If that means missing out on an initial wave 1, it's not a very big deal in the grand scheme of things...

$RIOT / 3hIt takes time for the waves to settle and the tide to change!!
Today, the price volatilities revealed the ultimate final subdivision of wave v in an integral sequence in five waves. Hence, today's 6.39 low might be considered a significant extreme point close to the Fib 1.272 expansion level on the channel.
Eventually, all waves settle! NASDAQ:RIOT should have concluded the entire correction in wave 2 by an ending expanding diagonal in its wave (c), which would indicate well to changing the trend in Minor degree to the upward.
#CryptoStocks #RIOT #BTCMining #Bitcoin #BTC

RIOT: Now it has turned into a triple combo correctionSunday night drop broke below $6.36, invalidating the minor wave 2 count and confirming that Intermediate wave 2 is still in progress. This price action can be a triple combination WXYXZ pattern. Now, good news is, this should be the last C wave leg. Bad news is it can still drop quite a bit more before the intermediate wave 2 is invalidated ($3.26). Even though I will most like get shaken out of my position, I will be looking to re-enter at the fib areas (1.618 extension and 2x extension), if price goes down there. Otherwise, I will wait for a bottom to confirm and buy in after a full five waves up and three waves down pattern. For now, need to stay away from the volatility.

RIOT: a hair away from invalidationFriday drop came about a hair length from invalidating my current count. But a strong reversal is keeping it intact still. We do not have a full 5 waves moves up to confirm a wave 1 yet. So, it is possible that Monday might sell off again and invalidate this count. If we lose the minor degree wave 2, then it will mean the Intermediate wave 2 is still on going. It will also mean there will be 2 more waves to complete a five waves move for wave C to the downside. Right now, market will need to prove the bottom, even though I nibbled in again at the low. I have a stop loss right at the $6.4 bottom if market decides to go down for some more. To have any confidence for a real reversal, we need to see price break above $8.24. Markets are very emotional and highly volatile. But Bitcoin is showing something out of character that is more aligned with its ethos rather than acting as a rick on asset. It could be history in the making, but now is too early to tell. If Bitcoin does become the safe haven asset to hide from recession as it was indented to do, then RIOT and other miners will surely benefit from it.

$RIOT / 3h#RiotPlatforms may have concluded the entire correction in Minor degree wave 2 by an ending expanding diagonal in its wave (c) of ((y)). This week NASDAQ:RIOT revealed a three-wave sequence as the final decline in wave v of (c), which should be over.
So, today's 6.40 low might be respected as a significant extreme point (very close to the Fib 1.272 expansion level on the channel).
The redline >> 6.36 has remained intact as well.
#CryptoStocks #RIOT #BTCMining #Bitcoin #BTC

RIOT - Fundamentals/Financials don’t matter. Staying Long CryptoI haven’t bought bitcoin mining stocks this market cycle, and don’t plan on buying them, but I thought this was an interesting exercise. MARA is the undisputed king of bitcoin mining and it’s not even close. From a fundamental and financial standpoint, MARA should be the best bitcoin mining stock to buy. But Technicals say RIOT may outperform MARA for the foreseeable future
1) Hash Rate (Mining Power):
💡Winner: MARA (53.7 EH/s)
* Why It Matters: More mining power means more BTC rewards and greater dominance in the industry.
* RIOT (39.1 EH/s) is the second biggest, but still behind MARA’s growth rate.
2) Bitcoin Holdings – Who Holds the Most BTC?
💡 Winner: MARA (46,374 BTC)
* Marathon holds almost 5x more Bitcoin than RIOT (8,872 BTC).
* Most miners sell BTC to fund operations, but MARA HODLs aggressively, a sign of strength
3) Mining Efficiency – Who Mines Bitcoin at the Lowest Cost?
💡 Winner: CleanSpark (CLSK) and MARA
* MARA’s cost per BTC is $28,801, lower than RIOT ($32,000) and similar to CleanSpark.
* How? MARA owns more of its energy sources, including a wind farm in Texas, cutting costs.
4) Revenue & Profitability – Who Makes the Most Money?
💡 Winner: MARA
* $656M revenue & $541M net income in 2024
* RIOT made $572M, but with much lower profit.
RIOT stock chart is currently trading in a descending channel which is inherently bullish, and is trading at a golden window support area ($4.81 - $6.54). RIOT is also printing a daily bullish dragonfly doji on the day the Dow Jones dropped 2,000 points. Unpopular opinion right now, I still believe we will see higher cryptocurrency prices for 2025-2026. I am expecting RIOT to tag the 0.618 fibbonaci retracement at $23.44 in the future.
Even though I anticipate RIOT doing a 3x, I still won’t buy it. Still sticking with LINK/XRP/BTC.
Not financial advice, but on a day like this, hold spot/shares only. Using leverage = Making exchanges richer. Aka sucking Middle Man D.

$RIOT / 3hEventually All Waves Settle!!
#RiotPlatforms has worked well, rising by 17% in three consecutive days this week.
According to the prior analysis in the same frame, NASDAQ:RIOT could have concluded the entire correction in its Minor degree wave 2 by an ending expanding diagonal in wave (c) of ((y)) on the Fib 1.618 expansion level (very close to the anticipated target at 6.87).
And technically, continuing to advance towards the origin point of the diagonal wave((c)) at 11.92, that would trace out a five-wave sequence in an impulse as well will highly confirm turning the trend to the upward.
Technical Initial Target >> 11.92
#CryptoStocks #RIOT #BTCMining #Bitcoin #BTC
