Gap swing on RTX w/strong risk-rewardRTX had an irrational sell off based on a potential 3 billion dollar cost on the recent engine problem with Pratt and Whitney. Meanwhile the stock which has been a key player for decades and lost over 20 billion in market cap in two enormous gaps. The stop-loss would be a 5% drawdown, and gap 1 a 15% upside gap 2 over 30% upside. Obviously the jet fuel play would be calls which is my preferred poison. RSI is down to 18 which is also obnoxious.
RTX trade ideas

$RTX $DFEN - Defense stocks will melt your face off Get ready for the ride of a lifetime on a Raytheon rocket exploding dollar bills all over your trading account. Massive dark pool buy in over 5 million last week. This one is good to buy and hold long term next 2 years. Why? We have a failing president with no support, and the best way to unite people is to start conflicts or wars that demand we stand together. There is no shortage of monetary support to ukraine. this last week they received more money than my home state of Hawaii did for our ravaged lands. Earnings were beat at RTX and they mentioned Ukraine about a half a dozen times. THey expect the conflict and the money to keep flowing.

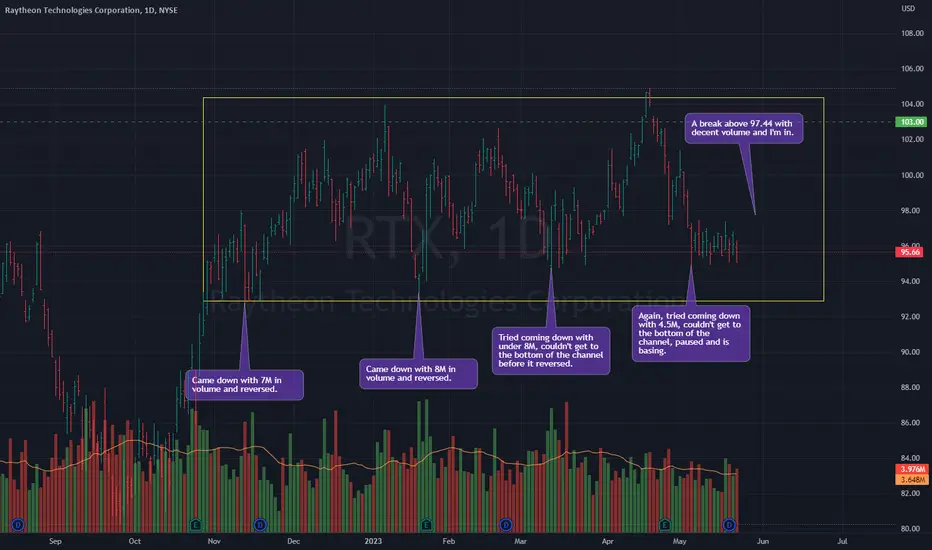
RTX Entry, Volume, Target, StopWhen price clears: 97.44
With above average daily volume.
Target: 103.00 area
Stop: Depending on your risk tolerance; 95.58 gets you 3/1 Risk/Reward
This swing trade idea is not trade advice and is strictly based on my ideas and technical analysis. No due diligence or fundamental analysis was performed while evaluating this trade idea. Do not take this trade based on my idea, do not follow anyone blindly, do your own analysis and due diligence. I am not a professional trader.
Raytheon - A Potential Earnings Pump To WatchEveryone wants to get rich quick. Because getting rich quick means you:
a) Get rich
b) Quick
Then you can wear big ugly sunglasses, a crappy t-shirt, flipflops, sit on the beach, eat a lot of meat, drink a lot of alcohol, and be promiscuous with women.
This is the modern human's dream, right?
And so everyone loves to speculate on potential earnings pumps and dumps.
There really is more to aim for in life.
Raytheon is one of the U.S. Military Industrial Complex cornerstones and is more or less a weapons mill for the NATO proxy war in Ukraine, which is of note because of the recent escalations of the conflict and how it can affect the U.S. Petrodollar, and thus bonds, oil, gold, equities, everything.
DXY - The US Petrdollar And The "Prigozhin Coup" In Russia
Geopolitically, the conflict between China and the International Rules Based Order is heating up. The current edict is to "de-risk but not decouple" from China (notice they never say "from the Chinese Communist Party"?).
In mid-June CEO Hayes was quoted by the propaganda machines as stating that decoupling from China was pretty much impossible because of all the parts and components that are manufactured in the mainland.
What this means, if you ask me, is that going forward, certain companies are going to have a very hard time meeting their target EPS and revenue estimates.
Raytheon may very well be one of them, as foreshadowed by a salvo of sanctions the Xi Jinping administration placed on them and Lockheed Martin.
The situation in China is very volatile right now. The IRBO wants control of China when the CCP falls. Xi Jinping and the other nationalists want to make sure that outside forces do not steal the motherland.
And so one day soon, we may find that Xi has thrown away the CCP in the middle of the U.S. night, and the markets will have themselves a series of consecutive red days like we've all never seen before.
Xi can weaponize the crimes against humanity that the Party and the Jiang Zemin faction have committed in the persecution of Falun Gong that started on July 20, 1999, and use the truth to protect both himself and China.
Organ harvesting and genocide of a group of 100 million spiritual cultivators with upright faith is certainly enough of a weapon to handle all the threats the motherland can be facing.
So why do you care about this if you're trading Raytheon?
Because a basic principle of markets is they go up when big money is selling and go down when big money is buying.
Raytheon and other military companies ironically never really pumped following the QE recovery from the COVID pandemic dump.
It wasn't until the Ukraine War began that Raytheon finally ran the highs.
And then it retraced.
That kind of retrace is actually really bullish and what bulls should want to see if they want their $145 billion~ company to become a $1.4 trillion company.
But the problem with the theory is more manifest on the weekly charts:
31 weeks of ranging and no breakout is not bullish.
And yet, after taking lows, it continues to recover. The most notable price swing is the $105 to $92 leg that just occurred.
I feel that Raytheon has some fundamental hidden bearish divergences to it and this is why it has traded this way all along, with the ultimate purpose of selling a lot high, and then selling it all above the all time high.
This hidden divergence, I think, is that U.S.-based companies may find themselves cut off from the Chinese supply chain in the very near future.
Only to tip all the bulls on their backs like stranded turtles and then dump and dump and dump and dump and not come back.
So I believe that with the setup at hand, the catalyst is actually the July earnings.
But if you look back at previous earnings, Raytheon doesn't have major pumps. It can go a bit and then it will run after.
Implied volatility on options for the July 28 expiry are only 20%, slightly higher than the 17% average.
But before we get there, I expect we're going to see prices return to the $92-93 range and give the best buying opportunity.
The catalyst for this, I believe, will simply be market-wide correction, which I outline in the following two posts:
Nasdaq - The Great Bear Trap
And
SPX/ES - An Analysis Of The 'JPM Collar'
In summary, there will be a shakeout in equities that will probably not be long lived, even if it's violent.
And after that, things will make their final run up, many of which will set new highs or new 52W highs, etc.
What's left for the remainder of 2023 and the start of 2024 doesn't look like it's going to be very pleasant, to speak frankly.
So make sure if you see Raytheon at a new high, you don't go getting ahead of yourself, longing the top.

$RTX with a bullish outlook following its earnings #StocksThe PEAD projected a bullish outlook for NYSE:RTX after a negative under reaction following its earnings release placing the stock in drift D with an expected accuracy of 100%.

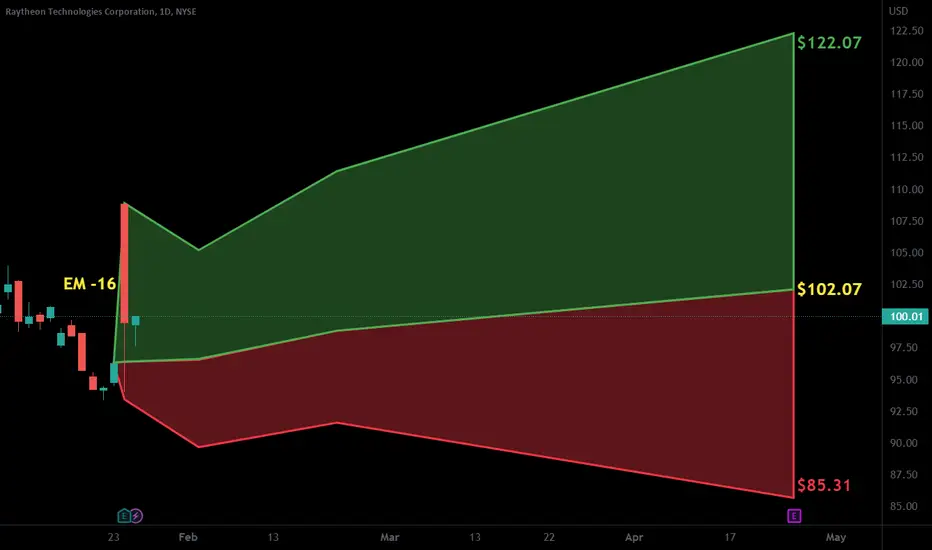
RTX to $104.82RTX hit and triggered an automatic entry at $99.08. Getting in now would give you even more buffer and a tighter stop-loss.
Entry: 97.34
Stop: 93.34
Risk on 10 lots: 40
Entry 97.34
Limit: 104.82
Gain on 10 lots: 74.80
Gain on 5 lots: 37.40

Raytheon Long @ 95.51/4 position.
Defense stocks are getting hit hard because of the debt ceiling situation. Should resume upwards once settled.

RAYTHEON TECHNOLOGIES CORPORATION higher bearish exp. to see
Hi viewers, RTX price break zone, tech. side showing we can expect higher bearish trend
TP1:92
TP2:89

$RTX with a Bullish outlook following its earnings #Stocks The PEAD projected a Bullish tral outlook for $RTX after a Positive over reaction following its earnings release placing the stock in drift B with an expected accuracy of 83.33%.
Raytheon Technologies: 3 Line Strike at PCZ of Bearish CypherThe Defense Sector in general seems to be overhyped as if it expects earnings not to matter anymore but the PE/Ratios keep rising as if it's betting on the US to enter a direct armed conflict rather than reality which is that we are simply just providing old unused equipment to the Ukraine. I think in the near future the market will realize this and we will see prices on these kinds of stocks got lower as the PE Ratios compress just like every other speculative growth stock has done during the cycle.

$RTX with a Bearish outlook following its earnings #Stocks The PEAD projected a Bearish outlook for $RTX after a Negative over reaction following its earnings release placing the stock in drift C with an expected accuracy of 50%.

Earnings watch 10/25Earnings watch 10/25:
HAL
ENPH
CMG
GM
TXN
RTX
GOOG
MSFT
KO
UPS
Do your own due diligence, your risk is 100% your responsibility. This is for educational and entertainment purposes only. You win some or you learn some. Consider being charitable with some of your profit to help humankind. Good luck and happy trading friends...
*3x lucky 7s of trading*
7pt Trading compass:
Price action, entry/exit
Volume average/direction
Trend, patterns, momentum
Newsworthy current events
Revenue
Earnings
Balance sheet
7 Common mistakes:
+5% portfolio trades, capital risk management
Beware of analyst's motives
Emotions & Opinions
FOMO : bad timing, the market is ruthless, be shrewd
Lack of planning & discipline
Forgetting restraint
Obdurate repetitive errors, no adaptation
7 Important tools:
Trading View app!, Brokerage UI
Accurate indicators & settings
Wide screen monitor/s
Trading log (pencil & graph paper)
Big, organized desk
Reading books, playing chess
Sorted watch-list
Checkout my indicators:
Fibonacci VIP - volume
Fibonacci MA7 - price
pi RSI - trend momentum
TTC - trend channel
AlertiT - notification
tickerTracker - MFI Oscillator
www.tradingview.com


Raytheon - Go ShortJust another dumb idea. Weekly has formed a descending triangle. Eventually this will break to the downside

Raytheon Technologies – Whopping 60% Shorting Opportunity?If you like this idea, please don’t forget to Boost it.
Fundamental Indicators:
Sector – Industrials
US Business Cycle Stage – late cycle, when this sector is neutral
Revenue – consistent growth for the past 5 years, although just 6% average annual rate, the performance in 2022 TTM is considerably slowing down
Profits – although slight increase in 2022TTM, it has still not recovered to pre-pandemic levels
Net margin – 7% which is still below pre-pandemic levels
P/E – the highest historic level with ratio of 31 compared to S&P500 with 21, Industrials sector with 21 and historic average level of 11
Liabilities - debt ratio is at 0.55 which is within the norm, Net Debt/ EBITDA is 2.48 – no problems with debt
Conclusion – although the company is recovering from pandemic but still hasn’t caught up to the previous levels, and given current overpriced valuation, it is very likely to go into correction to get back to the fair value
Technical Analysis (Elliott Waves):
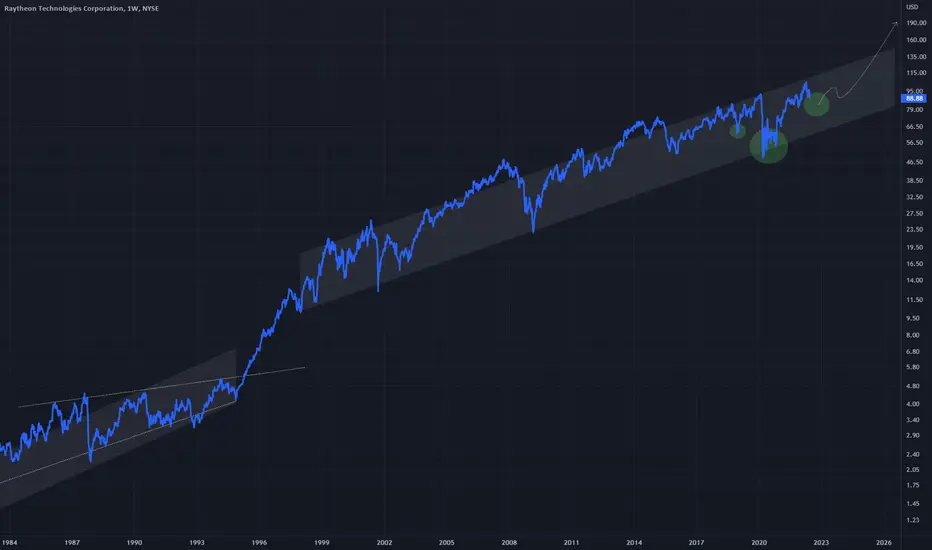
Main scenario of this idea suggests that we are still observing development of the global growth cycle which is currently at the stage of starting corrective wave 4 (see higher timeframe graph)
Since the longest correction in the shape of a Running Triangle that has lasted between 1987 and 1994 completed, this company has enjoyed explosive growth with circa 2100%. However, the whole movement is choppy with a lot of crossings hence likely to be an Ending Diagonal (see guidelines for Ending Diagonals below)
The historic high which was formed in March 2022 was the point of completion of wave 3 in the Ending Diagonal and now we are observing formation of the first leg of wave 4, presumably as a double zigzag. Wave W has completed, wave X is likely to finalise at the price level $97.32
Once completed, there will be another bull run in wave Y with the target range $67-$78 – which may present up to 30% shorting opportunity. However, longer term target is potentially $40 which is whopping 60%
This is a higher timeframe to reflect the full history of Raytheon Technologies Corporation and to provide full wave count:
This is the link to the guidelines for Ending Diagonals
What do you think about Raytheon Technologies Corporation and its short term prospects?
Also let me know if you would like to see other stocks, indices, Forex or Crypto analysed using Elliott Waves. And BOOST this idea if you like it.
Thanks

RTX - potential setupsNYSE:RTX
Raytheon Technologies Corporation , an aerospace and defense company, provides systems and services for the commercial, military, and government customers worldwide.
It operates through four segments: Collins Aerospace Systems, Pratt & Whitney, Raytheon Intelligence & Space, and Raytheon Missiles & Defense.
------------------------------------------------------------------------------------------------------------
👉 1. Price goes ABOVE the selected range on the picture. Long positions to activate.
👉 2. Price goes BELOW the selected range. below. Short positions to activate.
⚠️ Important Notes:
1. Follow your risk management rules.
2. Timeframes: up to 1D
Good luck and profit to all

RTX BULLISH SETUP The asset has now held the upper major support from its last ATH breakout. with nancy going east for ramen we shall have some potential interest in case china reacts to her visit to Taiwan.

Raytheon getting nuked. RTXIndeed. A Wave, B Wave as a condensing or constricting triangle, pivot and now just awaiting confirmation.
We are not in the business of getting every prediction right, no one ever does and that is not the aim of the game. The Fibonacci targets are highlighted in purple with invalidation in red. Confirmation level, where relevant, is a pink dotted, finite line. Fibonacci goals, it is prudent to suggest, are nothing more than mere fractally evident and therefore statistically likely levels that the market will go to. Having said that, the market will always do what it wants and always has a mind of its own. Therefore, none of this is financial advice, so do your own research and rely only on your own analysis. Trading is a true one man sport. Good luck out there and stay safe.

rtx 2 scenariosrtx 2 scenarios .. 1] buy after the break above the resistance 1 and 200ma .. 2]sell after the break under the support 1 and 50ma ..

$RTX with a Bullish outlook following its earnings #Stocks The PEAD projected a Bullish outlook for $RTX after a Negative Under reaction following its earnings release placing the stock in drift D with an expected accuracy of 100%.

Raytheon on the breakout ?A repeated patter on the weekly RTX chart appears to be forming, and technical indicators are set up similarly.
The daily chart is also in alignment as previously. Technical Indicators have just crossed over and suggest a breakout is in order.
About 15% upside potential with upside target at 113.80, about mid-September 2022.
Fundamental and geopolitical alignment should start appearing soon...
Watch this one!

RTX - Channel Breakout Long term chart for RTX showing two distinct channels
A large ascending triangle structure can be seen in the first to lead to the first channel breakout
The second is a inverted H&S structure which will lead to the break out of the second channel breakout which extends back to year 2000
Where the money at? $RTXI dont endorse war but in a see of red these stocks seem very atractive. 140+ for raytheon by EoY is very humble and realistic. :)
