$SAP with a Neutral outlook following its earnings #Stocks The PEAD projected a Neutral outlook for $SAP after a Negative over reaction following its earnings release placing the stock in drift C with an expected accuracy of 66.67%.
SAP/N trade ideas

SAP SE bearish scenario:The technical figure Pennant can be found in the daily chart in the German company SAP SE (SAP.de). SAP SE is a German multinational software company. It develops enterprise software to manage business operations and customer relations. The company is the world's leading enterprise resource planning (ERP) software vendor. SAP is the largest non-American software company by revenue, the world's third-largest publicly traded software company by revenue, and the second largest German company by market capitalization. The Pennant has broken through the support line on 17/08/2022, if the price holds below this level, you can have a possible bearish price movement with a forecast for the next 6 days towards 89.85 EUR. Your stop-loss order, according to experts, should be placed at 94.47 EUR if you decide to enter this position.
SAP SE has announced the acquisition of Askdata for an undisclosed amount to tap the growing demand for data and analytics solutions.
Per a research from Fortune Business Insights, the global big data analytics market is projected to reach $655.5 billion by 2029, at a CAGR of 13.4% from 2022 to 2029.
Risk Disclosure: Trading Foreign Exchange (Forex) and Contracts of Difference (CFD's) carries a high level of risk. By registering and signing up, any client affirms their understanding of their own personal accountability for all transactions performed within their account and recognizes the risks associated with trading on such markets and on such sites. Furthermore, one understands that the company carries zero influence over transactions, markets, and trading signals, therefore, cannot be held liable nor guarantee any profits or losses.

SAP SE (SAP.de) bullish scenario:The technical figure Falling Wedge can be found in the daily chart in the German company SAP SE (SAP.de). SAP SE is a German multinational software company. It develops enterprise software to manage business operations and customer relations. The company is the world's leading enterprise resource planning (ERP) software vendor. SAP is the largest non-American software company by revenue, the world's third-largest publicly traded software company by revenue, and the second largest German company by market capitalization. The Falling Wedge has broken through the resistance line on 23/07/2022, if the price holds above this level, you can have a possible bullish price movement with a forecast for the next 26 days towards 96.90 EUR. Your stop-loss order, according to experts, should be placed at 84.28 EUR if you decide to enter this position.
SAP SE SAP delivered second-quarter 2022 non-IFRS earnings of €0.96 per share down 45% from the year-ago quarter’s levels. The downside was caused by tougher year-over-year comparisons pertaining to contribution from Sapphire Ventures.
Total revenues, on a non-IFRS basis, were €7.517 billion ($8.009 billion), up 13% year over year, driven by strength in cloud business.
However, SAP has lowered full year operating profit guidance due to the €350-million negative impact from the war in Ukraine and expectations of a decline in software licenses revenue. The company now projects non-IFRS operating profit in the range of €7.6-€7.9 billion, indicating a decline of 4-8%. Earlier, the company guided non-IFRS operating profit in the range of €7.8-€8.25 billion, indicating flat to down 5%.
Risk Disclosure: Trading Foreign Exchange (Forex) and Contracts of Difference (CFD's) carries a high level of risk. By registering and signing up, any client affirms their understanding of their own personal accountability for all transactions performed within their account and recognizes the risks associated with trading on such markets and on such sites. Furthermore, one understands that the company carries zero influence over transactions, markets, and trading signals, therefore, cannot be held liable nor guarantee any profits or losses.

$SAP with a Bullish outlook following its earnings #Stocks The PEAD projected a Bullish outlook for $SAP after a Positive Under reaction following its earnings release placing the stock in drift A with an expected accuracy of 60%.

SAP or SADsad times for the tech giant, will finish the year sub $70. Value buy since there is a lot of function there

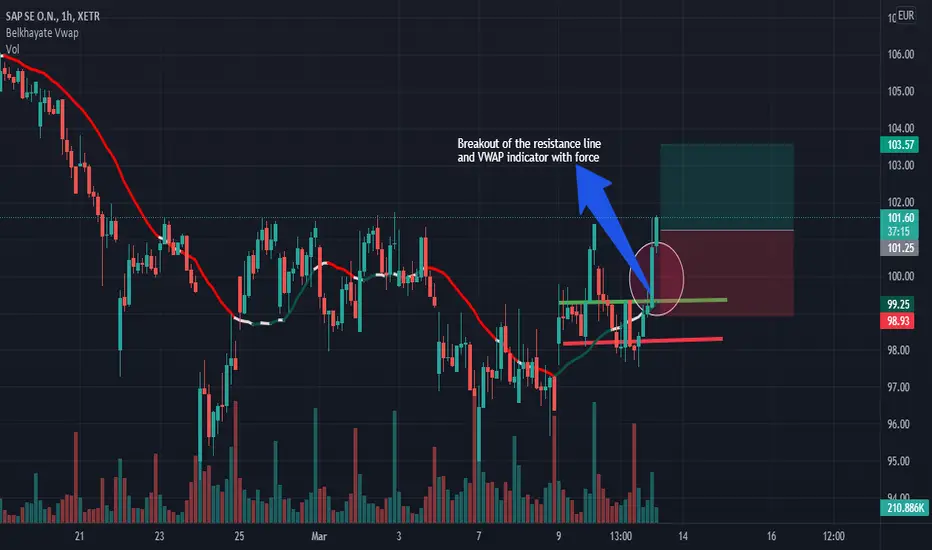
SAP SE O.N. (BUY)The RSI crosses the 50 mark and there is a large green candle that pierces the moving average.

dowside for SAPnothing rpetty to see here, looks bad have to take a look longe term but levels are far below
$SAP with a Neutral outlook following its earnings #Stocks The PEAD projected a Neutral outlook for $SAP after a Negative Under reaction following its earnings release placing the stock in drift D with an expected accuracy of 40%.

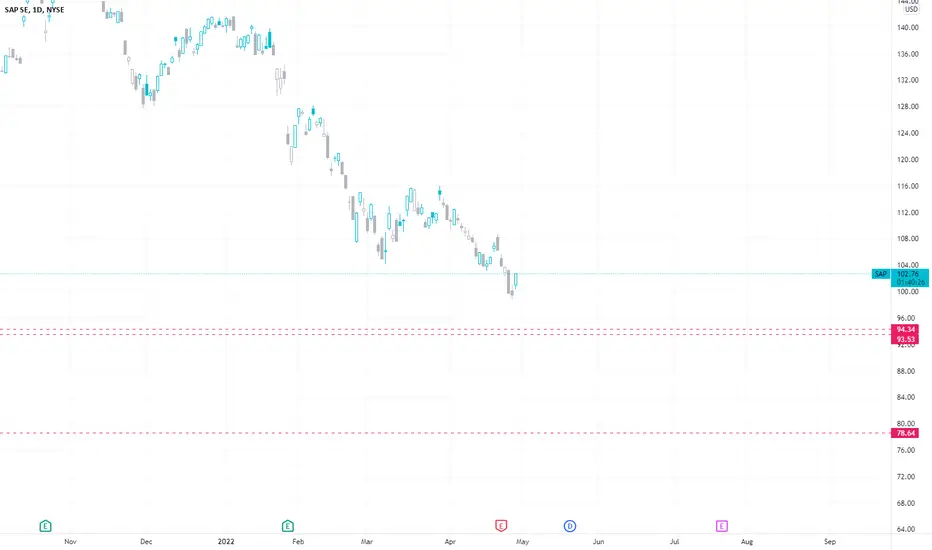
SAP downsideSeems like it'll keep falling here sub $100. Not sure with the current environment looks like for enterprise software but the momentum is on the downside. If it goes up level marked, well have to gain that support to keep going north

Long Sap stock. Outside barOn this stock we had have 3 linear closes and then a reversal outsidie bar. We bet for reversal from this point for several weeks.
Stop loss 90
Tp 120 or hold 7 -10 weeks

SAP, Head-Shoulder-Formation, Pivotal Determinations!Hello,
Welcome to this analysis about SAP on the monthly timeframe perspectives. As when looking at my chart we can watch there SAP os forming this massive head-shoulder-formation which is almost completed as the left shoulder and the head already developed. Now with the right shoulder SAP also broke down below the 65-EMA which is an important EMA that actually held the bullish trend to the upside previously, now as this EMA condition has changed this gives an additional indication that the head-shoulder-formation has a high possibility to complete in the upcoming times. Once SAP has formed the breakout below the neckline this will be the setup of completion for this whole head-shoulder-formation and SAP will activate the targets as seen in my chart, once these have been reached the situation needs to be elevated again.
In this manner, thank you for watching the analysis, all the best!
"The past like the future is indefinite and exists only as a spectrum of possibilities."
Information provided is only educational and should not be used to take action in the markets.

$SAP with a Bullish outlook following its earnings #Stocks The PEAD projected a Bullish outlook for $SAP after a Negative under reaction following its earnings release placing the stock in drift D with an expected accuracy of 44.44%.

Why does it dip or recover in March?SAP shares always dip and begin to recover in March, which is so unique about this stock. Someone long can sell of around Jan and buy back in March to get maximum returns

SAP is drainign itself. SAPShort term outlook.
Bearish outlook for gains at 128, then 119. Invalidation at 163.
Not as bad as Tesla, but way too overinflated in short.
We are not in the business of getting every prediction right, no one ever does and that is not the aim of the game. The Fibonacci targets are highlighted in purple with invalidation in red. Fibonacci goals, it is prudent to suggest, are nothing more than mere fractally evident and therefore statistically likely levels that the market will go to. Having said that, the market will always do what it wants and always has a mind of its own. Therefore, none of this is financial advice, so do your own research and rely only on your own analysis. Trading is a true one man sport. Good luck out there and stay safe!

SAP SE (SAP.de) bearish scenario:The technical figure Descending Triangle can be found in the German company SAP SE (SAP.de) at daily chart. SAP SE is a German multinational software corporation, that develops enterprise software to manage business operations and customer relations. The company is especially known for its ERP software. SAP is the largest non-American software company by revenue, the world's third-largest publicly-traded software company by revenue, and the largest German company by market capitalisation. The Descending Triangle has broken through the support line on 28/01/2022, if the price holds below this level you can have a possible bearish price movement with a forecast for the next 26 days towards 100.00 EUR. Your stop loss order according to experts should be placed at 125.32 EUR if you decide to enter this position.
SAP said on Thursday it has agreed to buy a majority stake in privately held U.S. fintech firm Taulia as the German business software group seeks to expand its presence in supply-chain financing and working capital management. SAP, said it was looking at opportunities in the ‘metaverse’ - virtual online worlds where people can work, play and socialize.
Risk Disclosure: Trading Foreign Exchange (Forex) and Contracts of Difference (CFD's) carries a high level of risk. By registering and signing up, any client affirms their understanding of their own personal accountability for all transactions performed within their account and recognizes the risks associated with trading on such markets and on such sites. Furthermore, one understands that the company carries zero influence over transactions, markets, and trading signals, therefore, cannot be held liable nor guarantee any profits or losses.

SAP, Paramount Bull-Flag Forms, Here Is How It Completes!Hello,
Welcome to this analysis about the SAP stock and the 2-day timeframe perspectives. Within the corona pandemic, many businesses, as well as private persons, moved into the home office and a boom in digitization emerged which is still ongoing. In this case, software companies like SAP or companies that have something to do with digitization could make huge increased profits which converted into rising prices in the stock market. These are the fundamentals that look quite positive, now when looking on the technical side of things I also detected a major decisive paramount formation SAP is forming here in the structure which is actually a bull flag formation as it is marked in my chart. The bull flag formation resulted out of an initial bullish impulse to the upside from where SAP moved on to form the bull flag which simultaneously is the wave B of the whole major wave count. Within this bull flag SAP also has a wave count with the waves A to E already completed and now as SAP approaches the lower boundary in which important supports lying together with the 500-EMA this is a important zone from where the main bounce can emerge. If this bounce is solid enough and SAP manages to increase bullishness from there on SAP will have a good ability to complete this whole bull flag formation with a final breakout above the upper boundary as it is marked in my chart, this will activate the upper target zone and once this zone has been reached the situation needs to be elevated again and SAP needs to show if it forms a continuation formation in this structure or firstly reverses initially, it will be an interesting development ahead.
In this manner, thank you for watching the analysis, all the best!
"Good fortune is when opportunity meets preparation."
Information provided is only educational and should not be used to take action in the markets.

$SAP with a Neutral outlook following its earnings #Stocks The PEAD projected a Neutral outlook for $SAP after a Negative over reaction following its earnings release placing the stock in drift C with an expected accuracy of 80%.
If you would like to see the Drift for another stock please message us. Also click on the Like Button if this was useful and follow us or join us.

SAP - We are only getting started!Dear subscribers and visitors, welcome back to another insight on SAP. XETR:SAP
After a long break, we will take a look at the SAP share and our past purchases. Those who have followed my advice and analysis can enjoy a cumulative profit of 53.08% so far.
The past reports can be viewed by everyone. In these reports I predicted the current share price and advised to buy SAP.
In recent months, we have completed several 1-2 waves, which are very positive for the future of SAP.
In the following months and years we can further expect higher prices. Soon the all-time high will be within our reach and every investor should keep the purchased shares.
However a slight chance remains that the "orange" wave 2 isn't completed yet and we could fall back to prices reaching 115$-110$.
Nevertheless, no panic or fear should arise, because this would represent only a small correction
Keep in mind that this are buy and hold position - unleveraged and without a stop-loss.
Long 2#
Entry: 101.74
Profit target: 150 and more !
Stop-Loss: None - Buy and hold
Long 1#
Entry: 97.23
Profit target: 150 and more !
Stop-Loss: None - Buy and hold

SAP SE volume and bi-directional indicatorsXETR:SAP
SAP SE XETR
Volume and Directional indicators suggest further possible upside.
Indicators names and design are my own.
Makalu; Volume based indicator using On Balance and Volume Flow concepts (yellow/purple)
Arun: Directional +/- momentum indicator (blue/red)

Market Cap trend - top Enterprise Application Software CompaniesMarket Cap changes in the last 5 years of the top Enterprise Application Software vendors, including IBM, Oracle, SAP and Salesforce.

$SAP with a Bullish outlook following its earnings #Stocks The PEAD projected a Bullish outlook for $SAP after a Positive Under-Reaction following its earnings release placing the stock in drift A
If you would like to see the Drift for another stock please message us. Also click on the Like Button if this was useful and follow us or join us.

