SKX longlistened to conf call this morning,, great company, very positive
i think sell off overdone
look for bounce
SKX trade ideas

downside more prevalent then upsideThe gap on the daily looks fillable and stock actually does look bullish on daily imo but on weekly just looks like a large bear flag so my best guess is to the downside.


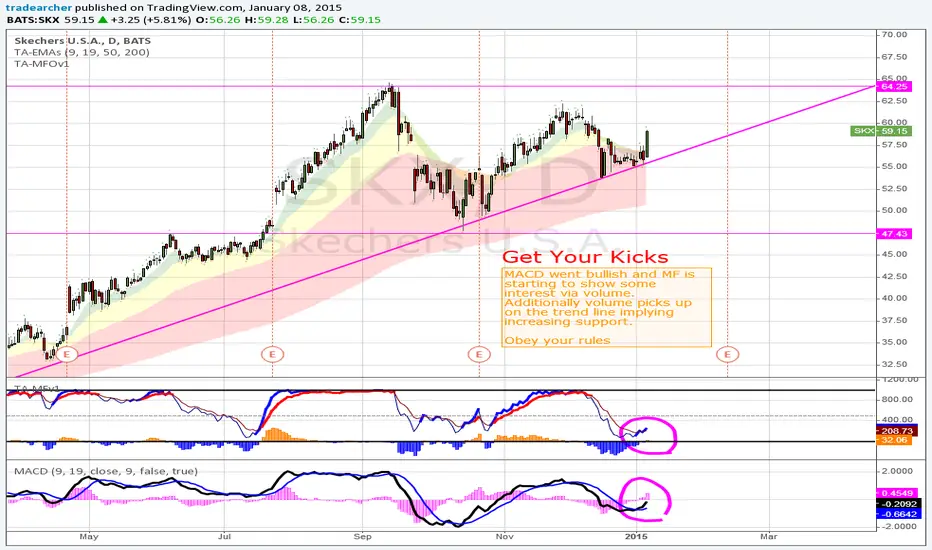
Skechers light on its feet to ResistanceSKX today had unusual Call Volume. Some traders are betting on this going up.
The long term action on Monthly and Weekly is showing this stock to be bearish. The move today brought the stock up to Daily resistance. I'm looking to test this resistance with short term JUL 16 29 Puts, holding them for just a few days, to see if this is the top of the move up. If it holds the resistance I'll be looking to take longer term bearish Put Options through earnings.

SKX ShortPrice action is conforming to theories on pitchforks, Fibonacci arcs and retractment. All this plus lower indicators are all spelling out immediate action in the next few days to consolidate after that last jump.

SKX Upwards to 30.75 next 35 daysSynopsis:
RSI, Stoch, MACD all point to up trend. (Strong signal)
Fibonacci confirms strong levels of support (26.70) and Resistance
Pitchfork showing downward and sideways trend, with price on the median.
Fib arcs show upcoming resistance zones (counting one we just entered)
I labeled the action reaction lines to help better understand what I was and am measuring to.
Expectations (Long):
4/11: Upwards following 1.618 underarc. some resistance at 0.236 arc
4/12: minor sideways and down movement along 0.236 arc, moving towards pitchfork median
4/13-14: moves up to 0.382 arc
4/15: Moves up towards 0.786 fib resistance line, .5 fib arc intersept
4/18: moves upwards to Reaction Line 2:1, Fib spiral, and .618 fib resistance level.
4/19-21: retraces to 0.786 fib support
4/22+: Upwards past 0.5 fib resistance, back towards Reaction Line 2:1 resistance


SKX Long Long LongExpected 10% rally in by 02/19/2016; strictly technical; BUY right before market close.

Long SKXThis stock doesn't offer pullback often. I will open long position, because I think now the RRR is better.

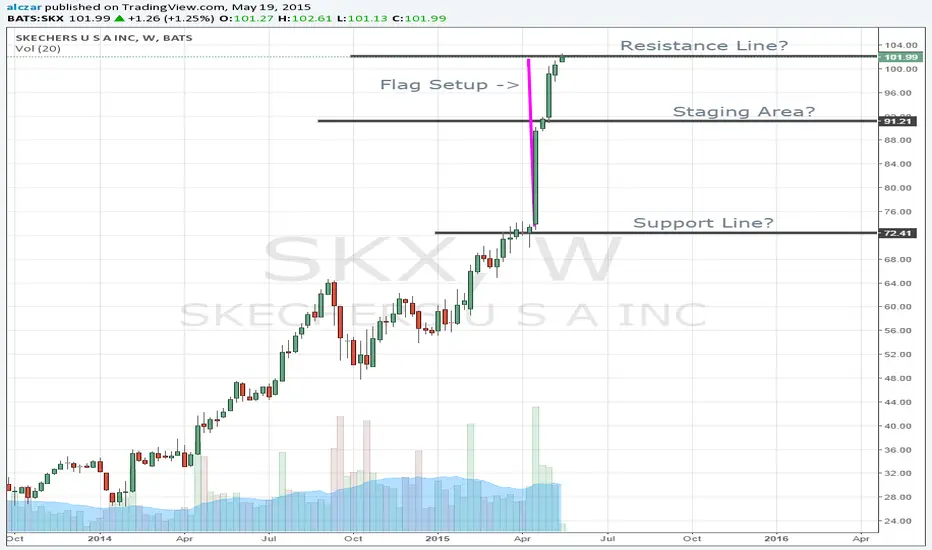
SKX is at resistance?SKX is setting up a Flag but, will hit resistance and head south to Staging area. Once at Staging area it could go North or South?
SKX-broke triangle and historic resistanceAnother stock with good fundamentals making new highs.
Details on the chart:
Company Fundamentals
*****************************
EPS Due Date 4/20/2015
EPS % Chg (Last Qtr) 71%
3 Year EPS Growth Rate 244%
EPS Est % Chg (Current Yr) 38%
Annual ROE 14.45%
Sales % Chg (Last Qtr) 26%
3 year Sales Growth Rate 17%
Market Cap $3.44 Bil
Profit Margin 4.8%
Sector apparel
Industry Group Rank 101
Industry Group Apparel-Shoes & Rel Mfg

SKX Day Trade Perfect Gap N Go (Brad Reed Feb11,2015)SKX expected to open at 62.86 for a Perfect Gap N Go. Watch out for slightly low volume. To learn to trade this strategy for free go to www.RealLifeTrading.com


3rd break out attemptAfter reaching all-time-high around 64.6, SKX has been selling off as low as 47.7 which coincide with downtrend channel bottom.
With price above 8,20,50 & 200ema currently, it looks set to make another launch to break the 1st resistance level which gotten rejected twice before.
This 2-in-1 resistance (horizontal level + downtrend channel top) @ 55.06 will be the hard nut to crack. Another failure to break out convincingly could see price falling to the bottom of channel lower than 47.74.

When divergence never existsThis shoe-makers has its unique way of making price action. Never at all on a monthly chart, i can find any sort of bearish divergence to help me enter short.
However, there is this one characteristic that surely is noticeable. Every single time the price reached a euphoric state, it will consolidation from 1-4 months before it freefall.
I would like to be abit different on the highlighted blue area here. I consider that the entire range of Sept engulfing entire range of Aug as Bearish Engulfing where Nison only use the open & close.
Though not entirely that price will listen to me, i made a projection of how price will fall in time to come.


Is SKX Next AAPL Stock?"Seeing is believing" if you crash # in this stock you will come the conclusion that the upside momentum has just begun. We are long since Feb 2013 and will not close. Expect another 70% move next 24 months. If you like follow us to find such this great investment.
