Sofi about to pop?$sofi #sofi High volume rejection at highest VPVR level and now stuck in channel. Currently pressing the top and 34EMA. H8 close above would open up a 13% move to resistance. Close above $15 and a lot of open air. Very possible to get rejected again though so be patient.
——————————————————————————————
Top 10 trading tips:
1. DO NOT FOMO into a trade. Let it come to you. Don’t force it.
2. Find a strategy that works for you and be consistent. Operate like a machine and less like the wind.
3. Let your winners run and cut your losers short.
4. You will not win every trade, but if you are disciplined with great RM you don't need to be right all the time to win!
5. Before you enter a trade, know your target AND your exit strategy.
6. When you are up, you can use a trailing stop or trim off some profit at a logical resistance point with a stop loss at breakeven.
7. Set your trade parameters up front so you keep your self accountable and remove emotions from the equation. (stop loss, take profit levels, etc)
8. Don't fight the trend. The trend is your friend.
9. Don’t enter a trade based on one indicator.
10. Horizontals > Diagonals
Please note:
- This is not financial advice.
- I do not take every trade I post.
- Never trade off of someone else's chart until you DYOR!
SOFI trade ideas

Reversal Imminent? NASDAQ:SOFI Been speculating that we are past the bottom of this current downtrend. Upcoming earnings/guidance coupled with being granted a bank charter may be catalyst enough to complete a reverse head and shoulders pattern and make its way back to the mid $14s for the completion. Volume declines have been consistent with the classic pattern and will be looking for an uptick in buying pressure soon to see this through. This would also indicate to me a potential reversal. This may present good buying opportunities in the mid $14s.
Not advice, this is my own speculation

SOFI: Many GOOD chart patterns around SUPPORT level.Hello traders and investors! Let’s see how SOFI is doing today! We’ll do a complete Multiple Time Frame Analysis (MTFA) and analyze the H, D and W charts.
First, we see that SOFI is doing what seems to be an Ascending Triangle chart pattern in the 1h chart. It is reacting near its support level, which is expected, and in theory, it is heading to the resistance at $ 13.41.
As someone who’s out, I see SOFI as a possible buy opportunity, as the Risk/Reward ratio makes much more sense for long trades than short trades. The time to short was at $ 24, when it did a Double Top pattern in the daily chart, now it makes sense to buy. Speaking of daily chart:
I see an inclined Inverted H&S chart pattern, which is a bullish reversal structure. If SOFI triggers upwards its Ascending Triangle in the hourly chart, we’ll probably see a confirmation of a breakout of this IH&S in the daily chart. This dual-pattern confirmation is quite interesting to see.
What’s more, this reaction couldn’t come in better time, as seen in the weekly chart:
In January, we just retested its support near the IPO price level, around the $ 11, and SOFI is trying to stabilize now. The volume is increasing, another good indicator, and if it confirms the patterns we discussed before, it could seek the next resistance at its 21 ema, or even the $ 16 again.
This is why I’m telling you, the Risk/Reward ratio is attractive, however, we must wait for better signs around. If you are already in, you must keep these points in mind, especially the support at $ 11, which SOFI must not lose at all cost.
I hope I helped you here, and I’ll keep you guys updated on this, so, remember to follow me to not miss any of my future analyses.

$SOFI - potential descending wedge breakout Sofi might be in a process of breaking out from the descending wedge. If the price break above $13.50, the pattern breakout is confirmed and the price could reach $18 near term.
The resistance areas to watch are $13.35, $14.83 and $17.21.
Target 1 - $14.83
Target 2 - $18
Risk - Unable to break above $13.35 and pull back to $11.75.
———————————————————
How to read my charts?
- Matching color trend lines shows the pattern. Sometimes a chart can have multiple patterns. Each pattern will have matching color trend lines.
- The yellow horizontal lines show support and resistance areas.
- Fib lines also show support and resistance areas.
- The dotted white lines show the price projection for breakout or breakdown target.
Disclaimer: Not investment advice.

There is still hope!
Sofi has proven to be an underestimated because of its high volatile markets. There is plenty of evidence of a huge jump happening between the final weeks leading up to earnings to a week after. The last time there was a 10.50 stock price in SOFI was the start of an explosion to $27.
Like in my previous idea, there is much evidence of averages telling us that the market is going up. The fact that they just became a bank that is offering plenty of incentives to convert customers and they are a low-cost bank. They do not have buildings like regular banks. They are a totally online which means they will definitely have higher earnings in ratio to debt than their counter partners. LOOK FOR THE LEAP

most likely moves lower this week 🍿sofi could reject at this trendline resistance! If we do and break below 11.81, my targets are 11.04-7.97-4.91. if we break above 13.95 my targets are 16.10-18.09. neutral until we get a trigger.
like and follow for more! 💘

SOFI Superbowl LVI hosted on the SoFi Stadium Two weeks ago you had the chance to buy SOFI at the SPAC price of Dec 2020.
What a round trip it made!
On Sunday, Superbowl LVI is hosted on the SoFi Stadium. It looks futuristic and will drive a lot of attention to its sponsor, SoFi, the online personal finance company that paid about $625 million for a 20-year naming rights deal.
My short term price target is the $14.15 resistance, but it can easily go to $17, which is the Bank of America`s price target for SoFi.
Looking forward to read your opinion about it.

SOFI to buy at ~10?What a brilliant chart is SOFI performing?! A great future is awaiting us! The best point at $10~. Good luck in trades, buddy.

SoFi: A Catalyst Saturated Fintech About To Drive Rapid GrowthSoFi has been beaten down, manipulated and ridiculed due to its SPAC origins… without even taking into perspective of the fast growth ahead of it.
The biggest reason that SoFi hasn’t seen rapid growth so far is due to the Biden Administration Extending Student Loan Pause Through May 1, 2022. I firmly expect this to be the last extension.
“The Department will continue its work to transition borrowers smoothly back into repayment…”
When this ends in combination with SoFi recently getting its bank charter approved… Revenue and Profit Projections will be updated to the positive.
SoFi has already started rolling out new features for members such as Margin trading, a 1.00% APY on both checking and savings (Market Leading) APY). More to come…
I highly expect SoFi’s upcoming earnings to be solid with an incredibly positive guidance ahead of it.
Many Major Analysts support this outlook with current ratings and price targets.
My Opinion:
$25+ is very realistic within the short term (2-4 months)
$35-$45 by end of the year with continued expansion in provided products as well as operations through CONUS & Internationally.
(Not a licensed financial advisor)

SOFI RESEARCH December 2021 to February 4, 2022Analyzed data points from December 2021 - Current date (Feburary 4, 2022)
Open High Low Close
Averages 14.13265 14.2891333333333 13.9624833333333 14.1164833333333
Minimums 10.71 11 10.515 10.715
Maximums 17.11 17.16 16.89 17.105
Look for a huge jump. They just become a central bank, and they have tons of incentives to attract customers. Great potential and extremely undervalued.

SOFI analysisSOFI has been plummeting and has a potential to fall below IPO price...Upcoming earnings will play a vital role in determining if that happens...I initially was going to go long at the $11 mark but have since decided to sit and watch for a bit...I really like this stock as it has tremendous growth potential but it's just not ready yet...Happy trading

Butterfly BAMM Looks to Take SOFI Down Another 58%The best way to play this would prolly be with some OTM Monthly PUTs around the $11 strike risking a smaller portion of your account that is what i will be doing here.
The linear 1.272 PCZ of this Butterfly Aligns with the logscale 1.618 This is no guarantee that SOFI will rise up from that point but i have a greater certainty that SOFI will reach that point so i will take the trade downwards.

SoFi TechnologiesHello fellows! What we have for now:
1. We have global positive news as SoFi becomes a bank
2. Having massive oversold situation to kill all margin traders after the news.
3. Technically having increasing volumes and diamond pattern in near future.
4. Already hit the bottom near IPO levels
Mentioning all above SoFi is strong buy mid-term.

Idea for $SOFI]Hey guys, I have recently started trading and thought i'd share this cool trading idea, SOFI is currently in a descending channel right now, and it is near the 13.64 level testing it, if tomorrow we can break that resistance level I can see us breaking the trendline and bouncing bullish out of the channel. On the 5 minute chart it is also forming a symmetrical triangle pattern, and if we can break out of it, I am going in with calls. Hopefully we see some strong volume as well. However, there is a chance we break bearish and continue the channel down. We'll see what happens at opening bell guys, GOOD LUCK 🤞.

SOFI long term prediction (90 days)SOFI is perfect for a swing trade right now. This is a great entry point. I cannot tell you what to buy or sell as I am not a financial advisor.


SofiSOFI best price AVG is $9 best to sell 16-17
However if you do not trade this stock 2025 price could easily reach $30 since the Management doing a great job.

SoFi Technologies, Inc (NASDAQ: $SOFI)Short term target: 11.80
Key level: 10.50
If the market keep going down and SOFI get under 10.50 the stock will get weaker and will go to lower levels.

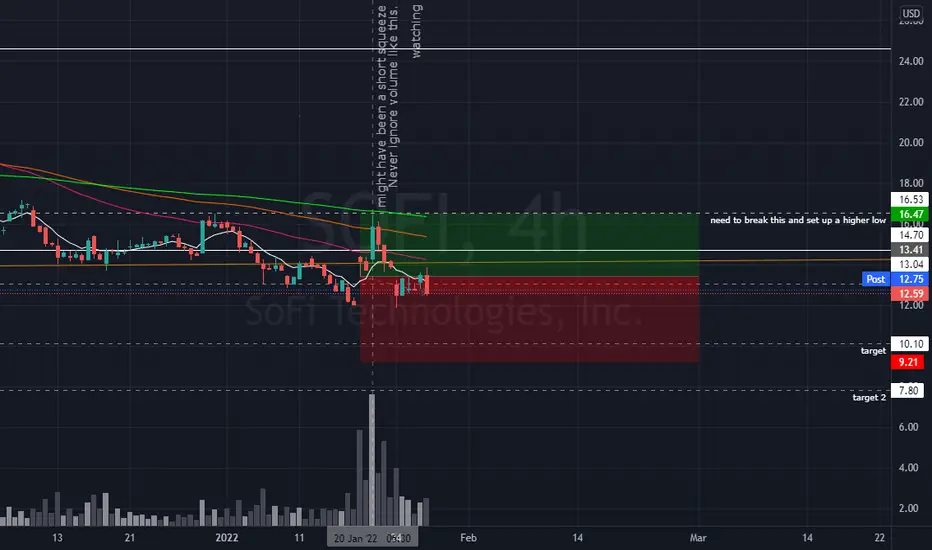
Sofi Watching closelyWatching for improvement on weekly storsi, which at the moment says we are going lower. but that volume can not be ignored. Eyes on this one.
$SOFI Short Term ReboundOur view is positive for a short term rebound as long as the price stays above the $12.40 pivot
The MACD must break above zero to trigger any additional gains

$SOFI Key Levels, Analysis & Targets. - REQUEST$SOFI Key Levels, Analysis & Targets. - REQUEST
By request for @StockTri
SOFI is definitely in a downtrend still… If you’re already long then I would only add at the green support levels and maybe at the blue trendline…
BUT If it breaks below those levels I would wait until the macD breaks above the centerline again before doing anything else… since there’s just about no support under there…
If you can train yourself to always think in terms of support and resistance levels you will do well.
I hope this is helpful.
——————
I am not your financial advisor, but I will happily answer questions and analyze to the best of my ability but ultimately the risk is on you. Check out my ideas, but also do your own due diligence.
I am not a bull. I am not a bear. I just see what I see in the charts and I don’t pay too much attention to the noise in the news.
If you want me to analyze any stock or ETF just leave me a comment and I’ll do it if I can. (If I have time)
Have fun, y’all!!
(\_/)
( •_•)
/ >🚀

SOFI | InformativeNASDAQ:SOFI
I'll open SHORT/LONG position based on bearish-bullish lines on the chart, it could have a break-out, but personally I expect a pull-back.
*This is my idea and could be wrong 100$

Sofi Green in a Sea of REDHello Traders,
Switching it up a bit and posting one for the stock boys and girls.
Bullish Falling wedge breakout
Bullish Divergence on the RSI
Bullish MACD Cross
Large Buy Volume
Entry: Anywhere near $14.23
Stop Loss: $11.92
Take Profit: $19.10
Have a Green week!
Savvy
