bullish targets smashed ;)spy broke my bullish targets i posted when it was 500, now struggling with a lower high at resistance zone, push down to 572-580 or so is possible before they try to push for all time highs🚀
boost and follow for more 💖
SPY trade ideas

SPY At Risk as Geopolitical Tensions Rise Jun 23 — What Monday Holds for Bulls & Bears ⚔️📉
🔍 GEX & Options Sentiment Overview:
From the daily GEX chart:
* Key Gamma Levels:
* 📍Call Walls: 597 → 602 (supply zones), strong resistance.
* 📍Put Walls: 590 → 587 → 572, significant gamma exposure to the downside.
* High Volatility Zone (HVL) at 590 – a trigger level; under this, the market may accelerate downside toward 587 and even 572.
* GEX Summary:
* PUTS: 80.4% dominance
* GEX Net: 🔴 extremely negative
* IVR 23.3, still on the lower side but rising
* Implication: Dealers are hedging to the downside. Gamma exposure creates risk of accelerated selloff below 590.
📊 Technical Analysis – Daily (1D)
* Price: 594.28 (as of Friday close)
* Trend: Daily candle broke prior support; new lower high confirmed.
* Structure:
* Failed to reclaim 597, now acting as local resistance
* Next major demand zone: 587
* Trendline from the recent highs shows lower highs; bearish continuation forming.
* Volume: Bearish candle closed with strong volume — sign of institutional distribution.
⏱️ Intraday TA – 1H Chart
* CHoCH/BOS: Confirmed Break of Structure near 591, then a small rally attempt.
* Micro Supply Box: 596.5–597.5 — liquidity trap if SPY rallies into it.
* Support Zones:
* 593.35 / 594.00 – holding Friday’s bounce.
* If fails, expect sweep to 590 → 587.
* Trendline Pressure: Downward diagonal trendline rejecting every bounce. Unless a full candle close over 599.50, bias remains bearish.
⚠️ Geopolitical Risk – U.S. Bombs Iran
* News: U.S. launched targeted airstrikes on Iranian assets. Market now faces:
* Flight to safety: TLT, Gold, and USD may rise.
* Oil likely spikes — expect XLE and energy stocks to outperform.
* Tech and indexes may open with gap-down risk due to heightened geopolitical uncertainty.
* SPY Implications:
* Risk-off behavior could amplify sell-off under 590.
* Traders may hedge via VIX calls, gold futures, or SPY puts.
* Watch for VIX spikes or DXY rally as confirmation of sentiment shift.
🧠 Trade Scenarios – Monday June 24
🔻 Bearish Case (High-Probability if Geopolitical Escalates)
* Rejects at 596–597 zone (supply)
* Entry: ~595–596 rejection
* Targets: 590 → 587 → 572 (extreme GEX)
* Stop: 598.5–599.2 above supply box
🔼 Bullish Case (If Market Shakes Off Iran Tension)
* Breaks over 597.5, closes above 599.5 (CHoCH confirmation)
* Entry: 598–599 breakout
* Targets: 602 → 604.5 (2nd Call Wall)
* Stop: 596.5
📌 My Thoughts:
SPY is sitting on a knife’s edge. GEX is screaming downside, and now geopolitical risk adds another layer of pressure. Monday could open with volatility spikes, and if the market gaps down under 590, it might cascade to 587 fast.
Only a reclaim above 599.5 invalidates the bearish structure — and even then, macro headlines might limit upside. Stay nimble. Hedge if holding longs.
🧭 Action Plan for Monday:
* Scalpers: Watch the 596–597 rejection zone — quick puts may work well.
* Swing traders: Use HVL 590 as pivot. Lose it? Target 587.
* Hedgers: VIX calls or GLD may provide cushion.
* Macro watchers: Monitor oil (USO), DXY, and bonds (TLT) for risk-on/off cues.
⚠️ Disclaimer:
This analysis is for educational purposes only. It is not financial advice. Always do your own research and manage risk carefully.

SPY: Expecting Bullish Continuation! Here is Why:
Balance of buyers and sellers on the SPY pair, that is best felt when all the timeframes are analyzed properly is shifting in favor of the buyers, therefore is it only natural that we go long on the pair.
Disclosure: I am part of Trade Nation's Influencer program and receive a monthly fee for using their TradingView charts in my analysis.
❤️ Please, support our work with like & comment! ❤️

Friday updateSPY likely put in an ABC, I expect lower for most of today. Gold probably higher for now. Oil is just consolidating. NG looks like a buy. BTC i think will breakdown under 100k over the weekend.

SPY/QQQ Plan Your Trade For 6-20 : Pause Bar PatternToday's Pause Bar pattern suggests the SPY/QQQ will slide into a sideways type of PAUSE in price action today. I'm not expecting much to happen and if we do see any breakaway or breakdown trending it will likely be related to news.
While we have options expiration today and a host of other things that could drive the markets, I believe the markets are struggling to find direction right now. Thus, a pause in trading would be somewhat normal after a holiday-shortened trading week.
Gold and Silver are struggling after a brief rally last week. I believe this is fear related to the Israel/Iran conflict. Metals should continue to move higher.
BTCUSD is slightly higher (forgot to cover BTCUSD in the video), but not moving into a breakaway phase.
Overall, everything is very flat in early trading today. It may stay that way with my PAUSE BAR pattern.
Get some.
#trading #research #investing #tradingalgos #tradingsignals #cycles #fibonacci #elliotwave #modelingsystems #stocks #bitcoin #btcusd #cryptos #spy #gold #nq #investing #trading #spytrading #spymarket #tradingmarket #stockmarket #silver

Nightly $SPY / $SPX Scenarios for June 20, 2025🔮 Nightly AMEX:SPY / SP:SPX Scenarios for June 20, 2025 🔮
🌍 Market-Moving News 🌍
🏦 Fed Holds Rates, Warns on Tariffs
Fed kept interest rates steady on June 19, cautioning that tariffs could stoke inflation and slow growth. Inflation projections were raised from 2.7% to 3.0%, while growth estimates were revised lower to 1.4%
🌍 Middle East Risk Drags Markets
Global stocks fell and safe-haven assets surged after U.S. futures weakened amid heightened tensions in the Israel–Iran conflict. Yields were mixed: gold weakened and bonds gained, while oil held steady near seven-week highs
📈 Treasury Yields Edge Higher
Despite safe-haven demand, U.S. 10‑year yields ticked up as markets absorbed the Fed’s updated rate outlook. The yield curve remains elevated ahead of next week’s $38 bn auction of long-dated notes
📊 Key Data Releases 📊
📅 Friday, June 20:
(No major U.S. economic reports)
Markets will be driven by Fed commentary follow-ups and geopolitical headlines over the weekend.
⚠️ Disclaimer:
This information is for educational and informational purposes only and should not be construed as financial advice. Always consult a licensed financial advisor before making investment decisions.
📌 #trading #stockmarket #economy #geopolitics #fixedincome #inflation #charting #technicalanalysis

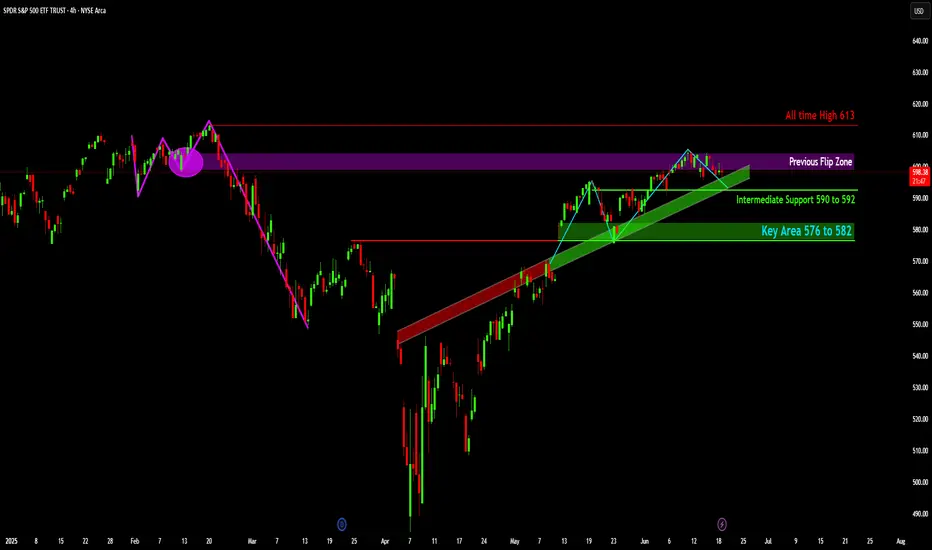
SPY: What's Next After the Resistance Retest?
The price action of SPY, shows a significant decline from early February highs, followed by a strong recovery and an established uptrend from mid-April.
Price is currently testing the "Previous Flip Zone" (indicated by the purple shaded area), a level that previously acted as support before the market's sharp decline and has since been retested as resistance.
The "All time High 613" is marked as a major overhead resistance level, representing the peak achieved before the February drawdown.
An "Intermediate Support" zone is identified between 590 and 592, coinciding with the upward-sloping green trendline that has supported the recent rally.
A "Key Area" of support is highlighted further down between 576 and 582, indicating a more substantial demand zone should the intermediate support be breached.
Disclaimer:
The information provided in this chart is for educational and informational purposes only and should not be considered as investment advice. Trading and investing involve substantial risk and are not suitable for every investor. You should carefully consider your financial situation and consult with a financial advisor before making any investment decisions. The creator of this chart does not guarantee any specific outcome or profit and is not responsible for any losses incurred as a result of using this information. Past performance is not indicative of future results. Use this information at your own risk. This chart has been created for my own improvement in Trading and Investment Analysis. Please do your own analysis before any investments.
Nightly $SPY / $SPX Scenarios for July 2, 2025🔮 Nightly AMEX:SPY / SP:SPX Scenarios for July 2, 2025 🔮
🌍 Market-Moving News 🌍
🏭 U.S. Manufacturing Remains Under Pressure
The ISM Manufacturing PMI for June rose slightly to 49.0 from 48.5 in May—still in contraction territory. Tariff-induced uncertainty and rising input costs continue to weigh on factory activity, with new orders still weak and employment contracting
📈 Global Factory Rebound Led by India & Europe
While U.S. factories struggle, India hit a 14-month high in its manufacturing PMI at 58.4, and euro‑zone factory orders stabilized at 49.5—the first sign of recovery in over three years. Asia-Europe divergence may shift global capital flows .
🏦 Powell Says Tariffs Are Delaying Rate Cuts
Fed Chair Powell warned at the ECB forum in Sintra that elevated inflation—driven in part by Trump-era tariffs—has postponed the timeline for U.S. rate cuts. The Fed’s dot-plot now indicates only two cuts for 2025, with markets adjusting accordingly
💵 Dollar Nears 3½-Year Lows
The U.S. dollar weakened further, trading near a three-and-a-half-year low amid soft PMI data, a dovish Fed tilt, and renewed optimism over U.S.–Canada trade talks
📊 Key Data Releases & Events 📊
📅 Wednesday, July 2:
(No major scheduled U.S. economic data)
Market focus shifts to upcoming Nonfarm Payrolls on July 3, Powell's remarks, and trade-talk headlines.
⚠️ Disclaimer:
This information is for educational and informational purposes only and should not be construed as financial advice. Always consult a licensed financial advisor before making investment decisions.
📌 #trading #stockmarket #economy #manufacturing #Fed #inflation #charting #technicalanalysis

Update on the markets 7-1-2025SPX still floating but IWM and DJT are both having strong rallies, which usually means SPX will go higher today or tomorrow. Gold is at resistance. NG is a support. OIl still looks like a bear flag. BTC is pulling back from 107k - again.

~ June 19th 2025 - S&P 500 SPY ...new all time high ...S&P 500 SPY broke recent resistance 604.45 & closed above Feb 19th/ 25 all time high of 613.23 on Friday. Will be watching the open on Monday .... specifically Friday's all time high closing number 614.91

SPY soars to new all time highsThere has been a lot of speculation about where SPY is going next. I believe a significant correction will happen in the near future. However, today SPY is creeping back into the strong uptrend it once had. Looking at chart patterns, SPY is building momentum once more and will be hitting another yet another all time high.

Nightly $SPY / $SPX Scenarios for June 26, 2025🔮 Nightly AMEX:SPY / SP:SPX Scenarios for June 26, 2025 🔮
🌍 Market-Moving News 🌍
💱 Dollar Mounts Decline on Fed Credibility Concerns
The U.S. dollar dropped to a 3½-year low against the euro after reports that President Trump is considering replacing Fed Chair Powell as early as September or October. The move fueled market concern about the Fed’s independence and prompted traders to raise the likelihood of a July rate cut to 25%, with nearly 64 bps of rate cuts priced in by year-end
📉 Markets Stay Cautious Ahead of Powell’s Testimony
Traders remain on edge as Fed Chair Powell’s Capitol Hill testimony continues. He reiterated caution, noting inflation risks tied to tariffs despite growing calls for easing, keeping interest-rate expectations in limbo .
📈 S&P 500 Nears All-Time Highs in Second-Biggest Bi‑Monthly Rally
The S&P 500 has notched its second-largest May–June rally on record (6.2% in May, further gains in June), bolstered by cooling inflation, easing Middle East tensions, and strong AI earnings momentum led by Nvidia. Bull-case scenarios could push the index to fresh highs
📊 Key Data Releases 📊
📅 Thursday, June 26:
(No major U.S. economic release—markets are focused on Powell’s remaining testimony and global risk dynamics.)
⚠️ Disclaimer:
This information is for educational and informational purposes only and should not be construed as financial advice. Always consult a licensed financial advisor before making investment decisions.
📌 #trading #stockmarket #economy #Fed #inflation #geopolitics #technicalanalysis

SPY 15-Min — Weak-High Sweep in Play• Discount BOS at 603.95 → impulsive leg to 606.7 (0.886)
• Weak high tagged at 607.16 – expecting continuation to 1.382 ≈ 608.61 then 1.854 ≈ 610.92
• Invalidation if price closes below 605.45 session VWAP band
• Targets: 608.61 → 610.92
• Risk: stop 604.9 (below 0.5 Fib)
VolanX bias remains risk-on while micro structure stair-steps above the 9-EMA channel.
Educational only – not financial advice
#SPY #SMP500 #OrderFlow #Fib #VolanX #WaverVanir

SPY- Premarket readPre-Market Read – June 23
AMEX:SPY
Premarket High: 595.15
Premarket Low: 592.15
Bias: Leaning Bearish
Price got rejected again at that 600–602 zone — that’s been a wall.
All the EMAs (9/50/200) are stacked tight, which usually means something’s brewing.
Institutions bought heavy down around 572–579 — they’re already green, so they might start selling into strength.
I’m expecting chop between 593–595 off the open.
I’ll probably wait out the first 15 min and let the ORB build.
If we break out, I’m watching both sides, but I lean put.
579 spy incoming?I posted this a week or so ago. I think we are finally going to have the momentum, or lack thereof, to make it down to fill the rest of that gap. I have noticed that large gaps that leave a small gap below(you must adjust the indicator to show it) almost always get filled before continuing up. This 579 level also matches up perfectly with the 20ema on the weekly which should provide further support. I will be looking for this level all week while being aware of any short squeezes that could occur on the way down. Will definitely go long at this 579 level as I think we will have a very green July.

Weekly $SPY / $SPX Scenarios for June 23–27, 2025🔮 Weekly AMEX:SPY / SP:SPX Scenarios for June 23–27, 2025 🔮
🌍 Market-Moving News 🌍
🌐 Geopolitics Add to Risk Aversion
The S&P 500 is up about 0.9% so far in June, but analysts warn it’s facing a “precarious” phase amid renewed Middle East conflict and looming U.S. tariff deadlines in July–August. Elevated oil prices could fuel inflation, while fiscal and debt ceiling pressures weigh on sentiment
🎙️ Powell Heads to Capitol Hill
Fed Chair Powell will testify before Congress this week. His remarks on inflation and rate outlook—particularly regarding the Fed’s recent dot-plot revisions and monetary policy uncertainty—will be central to market direction
📈 Nike, FedEx & Micron Earnings Under Focus
Key corporate earnings (Nike, FedEx, Micron) could provide fresh insight into how tariffs and supply-chain disruptions are impacting major U.S. businesses
🛢️ Oil Prices Elevated
Oil remains range-bound at multi-week highs near $75–80/bbl following U.S.–Israel military action in Iran, which briefly spiked prices ~7–11%. Continued dependence on Middle Eastern supply may keep energy complex volatile
⚖️ NATO Summit Tightens Security Focus
NATO leaders meet in The Hague, marking an elevated global defense posture amid geopolitical uncertainty. Defense and aerospace stocks may remain pressured or volatile depending on summit outcomes
📊 Key Data Releases & Events 📊
📅 Monday, June 23
9:45 AM ET: S&P Global Flash U.S. Services & Manufacturing PMI (June)
10:00 AM ET: Existing Home Sales (May)
📅 Tuesday, June 24
10:00 AM ET: Consumer Confidence Index (June)
Testimony: Fed Chair Jerome Powell appears before Congress
📅 Wednesday, June 25
10:00 AM ET: New Home Sales (May)
📅 Thursday, June 26
8:30 AM ET: Advance Q1 GDP (Final Estimate)
📅 Friday, June 27
8:30 AM ET: Core PCE Price Index (May) — Fed’s preferred inflation gauge
⚠️ Disclaimer:
This is for educational and informational purposes only. It does not constitute financial advice. Always consult a licensed financial advisor before investing.
📌 #trading #stockmarket #economy #geopolitics #Fed #oil #charting #technicalanalysis

$SPY Call Credit Spread for 7/3 Expy IdeaAMEX:SPY Call Credit Spread
+1 $604 call 7/3
-1 $600 call 7/3
~$200 credit
1:1 risk:reward
Breakeven @ Expy = $602
We'll see...

SPY/QQQ Plan Your Trade For 6-18 : GAP Potential PatternToday's GAP Potential pattern suggests the SPY/QQQ may GAP a bit higher at the open, then move into a melt-up phase, trying to identify resistance, then roll into a topping pattern and move downward.
I believe the recent "rollover" of the markets (initiating last Friday with the Israel/Iran conflict) is still dominating the markets and news related to the ongoing conflict could drive a moderate pullback in US assets.
Headed into the Juneteenth holiday (Thursday, June 19), I suggest traders prepare for the US markets to move into somewhat of a SETTLEMENT mode today - where traders don't want to hold too many open positions into Friday's trading.
Additionally, Gold and Silver could move into a very strong upward price move over the next 4-5+ days. So be prepared for metals to hedge risks when the US stock market is closed.
BTCUSD seems to be struggling into the FLAG APEX. I'm waiting to see if my FLAG count is correct and if we get the breakdown in BTCUSD as I expect.
Get some.
#trading #research #investing #tradingalgos #tradingsignals #cycles #fibonacci #elliotwave #modelingsystems #stocks #bitcoin #btcusd #cryptos #spy #gold #nq #investing #trading #spytrading #spymarket #tradingmarket #stockmarket #silver

SPY repeating patternsSo just look at patterns that coincide with the RSI. Just keep an eye on the levels & channels & paly it smart

Nightly $SPY / $SPX Scenarios for June 18, 2025🔮 Nightly AMEX:SPY / SP:SPX Scenarios for June 18, 2025 🔮
🌍 Market-Moving News 🌍
💼 Business Inventories Flat in April
U.S. business inventories held steady in April, indicating stable consumer and wholesale demand. That suggests production won't need to cut sharply in the near term, supporting GDP outlook
🏭 Industrial Production Slips
Industrial output declined 0.2% in May, signaling ongoing weakness in factory activity amid less favorable global trade conditions .
🌐 Geopolitical Pressures Persist
Heightened tension in the Middle East continues to pressure risk assets. Investors remain focused on safe-haven flows into gold, Treasuries, and defensive equities, with analysts noting the risk backdrop remains tilted to the downside
📊 Key Data Releases 📊
📅 Wednesday, June 18:
8:30 AM ET – Housing Starts & Building Permits (May)
Measures new residential construction — leading indication of housing sector health.
8:30 AM ET – Initial Jobless Claims
Tracks the weekly count of new unemployment filings — useful for spotting early labor-market weakening.
2:00 PM ET – FOMC Interest Rate Decision
The Federal Reserve is expected to hold steady. Market focus will be on any commentary that hints at future tightening or easing plans.
2:30 PM ET – Fed Chair Powell Press Conference
Investors will parse Powell’s remarks for guidance on rate paths, inflation trends, and economic risks.
⚠️ Disclaimer:
This is for educational/informational purposes only and does not constitute financial advice. Consult a licensed advisor before making investment decisions.
📌 #trading #stockmarket #economy #housing #Fed #geo_risk #charting #technicalanalysis

(No) IdeaWhy the handle of "The Uncertain Trader"? Let's check the daily SPY (S&P 500 ETF) chart just after the close of 17 Jun 2025;
I've got no idea where this thing is going.
Thus the handle.
No one has any idea where this is going. If they insist they do they are selling you something. In the words of Brad Hamilton, "Learn it. Know it. Live it".
However, one must form a hypothesis to trade from, right or wrong. And TradingView has excellent tools to do so AND a FREE social network to share such theories.
Back to SPY, I have my suspicions;
SPY closed at 597.53, below it's all-time high of 611.39 (gray line and box) from Feb 19 and above it's 200 day simple moving average of 577.41 (purple line and box). Besides some support at 595.48 (arrow), which is way too close to be useful, and maybe resistance at Wed's high (also too close), there's really no other obvious support or resistance. So, it's ~14 points to the solid resistance at that significant high and ~20 points to support. If one goes long it's 20 points to be proven wrong, 14 points to the good and where the trade will likely stall - not a good reward to risk. Going short is a little better, with 20 points to support with 14 points of risk, but still a rather meager reward to risk.
And now factor in an FOMC meeting tomorrow (Wed 18th). SPY could easily hit one of those marks (2.3% up, 3.4% down), or both, tomorrow afternoon.
The (safer) play is to hold off, stay neutral, and let SPY resolve this, up or down. Let it test/hold it's all-time high or it's 200-day.
Again, I have no idea where this is going - just my theory.
And please, read the following and, again, "Learn it. Know it. Live it";
My ideas here on TradingView are for educational purposes only. It is NOT trading advice. I often lose money and you would be a fool to follow me blindly.

$SPY // June 17 2025 // CPI Analysis & Targets for Day TradersAMEX:SPY // June 17 2025 // CPI Analysis & Targets for Day Traders

SPY/QQQ Plan Your Trade for 6-17: Top Resistance PatternToday's pattern suggests the SPY/QQQ will move into a type of topping pattern, attempting to identify resistance, then roll away from that resistance level and trend downward.
I suggest the news related to the conflict between Israel & Iran may continue to drive market trends with traders moving away from uncertainty near these recent highs.
Silver makes a big move higher. Gold will likely follow later this week or early next week.
BTCUSD moves into a sideways FLAGGING pattern - possibly attempting a BIG BREAKDOWN event over the next few weeks.
Overall, the markets look like they are poised for a very big move - just waiting for the GREEN LINK (GO).
Stay safe. Protect capital and HEDGE.
Get some.
#trading #research #investing #tradingalgos #tradingsignals #cycles #fibonacci #elliotwave #modelingsystems #stocks #bitcoin #btcusd #cryptos #spy #gold #nq #investing #trading #spytrading #spymarket #tradingmarket #stockmarket #silver
