Sqqq boxing
I'm afraid FED will do sth to save Tech section. if Hi-teck crack, the us marketing might failed to
soft landing.
hahaha~~
it seems that there was tricky stuff happened in the past week.
I just took my gains and will keep surfing in the coming weeks
SQQQ trade ideas

"Decoding Market Signals: SQQQ Shines Amidst Bearish Trends"Greetings, Traders and Enthusiasts!
In the ever-fluctuating world of stock trading, finding patterns and signals that defy the market norm is nothing short of striking gold. Today, we delve into the intriguing world of the ProShares UltraPro Short QQQ ETF (SQQQ), a beacon of bullishness amidst the bearish market trends. Buckle up as we unravel the mystery behind SQQQ’s exceptional performance and what it might mean for the broader market in the days and weeks to come.
Analyzing SQQQ's Performance: A Bullish Standout in a Bearish Market
At first glance, the numbers might seem daunting: SQQQ trading at $20.35, down by 2.44% from the previous day. However, the devil is in the details, and a closer look at the daily chart reveals a compelling narrative. The 21-day resistance line stands tall, providing a robust backbone to the ETF’s current position.
The Hourly Chart: A New Support Horizon Emerges
Delving deeper into the hourly chart, a new support line emerges. What makes this line significant is not just its existence, but the respect it commands. SQQQ’s price action adheres to this support line, showcasing a remarkable display of consistency and reliability in turbulent times.
Decoding Patterns: The Ascending Triangle
Within this intricate dance of numbers and charts, a pattern emerges – the ascending triangle. This pattern, marked by its distinct shape, signifies a period of consolidation before an upward breakout. SQQQ’s price oscillation within the triangle's nose is akin to the calm before a storm, hinting at potential significant movements in the days and weeks ahead.
The Implications for the Market
SQQQ’s unexpected bullish behavior in the midst of an otherwise bearish market is nothing short of fascinating. Could this anomaly be a precursor to a larger trend reversal? While past performance is not always indicative of future results, the consistency with which SQQQ has held its ground presents an intriguing scenario.
A Glimpse into the Future
As traders, it’s our nature to seek patterns, anticipate trends, and decode the mysteries of the market. SQQQ’s behavior serves as a beacon, guiding us through the uncertainties of the trading world. While we cannot predict the future with absolute certainty, the signs and patterns we observe today may very well shape the market landscape of tomorrow.
Trade Idea
If you believe that the market is about to turn bearish, you could consider trading SQQQ. However, it is important to note that SQQQ is a leveraged ETF, which means that it is more volatile than the underlying index. It is also important to note that SQQQ is a short-term trading vehicle, and it is not meant to be held for long periods of time.
Risk Management
If you do decide to trade SQQQ, it is important to use proper risk management. You should only risk a small percentage of your capital on any given trade, and you should use a stop-loss order to limit your losses.
In conclusion , SQQQ’s bullish stance amidst a bearish market paints a vivid picture of possibility. Whether you're a seasoned trader or a curious enthusiast, keeping a close eye on SQQQ’s movements could provide valuable insights into the market's future direction. As always, trade wisely, stay informed, and may your investments be ever prosperous.
Happy trading!
Disclaimer: The information provided in this blog post is for educational and informational purposes only. It does not constitute financial advice, and the author and the platform are not responsible for any trading decisions made based on this information. Always conduct your research and consult with a qualified financial advisor before making any investment decisions.

$SQQQ Quarter 3 (Q3) AnalysisI also believe that SQQQ will form a new all-time low below $16.92 in Q4. Currently SQQQ is sitting directly below a resistance zone between $20.90 and $21.74, and the EMA ribbon is acting as an area of resistance. For bears that are long on SQQQ, the yellow resistance zone is a key price target and the next key price target on the way up is $29.19.

SQQQ - trend reversalhi Traders
Let's have a look at SQQQ daily chart.
SQQQ was in a long-term downtrend but now SQQQ is looking interesting agian.
We can observe the higher low structure which shows the accumulation.
The trend has a chance to reverse from here and this is the area were longs may be taken.
Mid- term target for longs: 28$ -31,48$
Do you agree?

SQQQ: Bullish Butterfly with PPO Circle and MACD DivergenceThe SQQQ has given us PPO Confirmation at a potential 1.414 Bullish Butterfly PCZ and has topped it off with MACD Hidden Bullish Divergence. If we are to see the QQQ pull back 50-65% then the SQQQ should go up about 100-200% from here, though I may end up just targeting $32 depending on how fast it goes.

Looking good! SQQQOn the daily chart SQQQ broke out of downtrend! Retest looks completed! Heading north from here!

SQQQ Stock Chart Fibonacci Analysis 090623 Trading Idea
1) Find a FIBO slingshot
2) Check FIBO 61.80% level
3) Entry Point > 114/61.80%
Chart time frame : B
A) 15 min(1W-3M)
B) 1 hr(3M-6M)
C) 4 hr(6M-1year)
D) 1 day(1-3years)
Stock progress : A
A) Keep rising over 61.80% resistance
B) 61.80% resistance
C) Hit the bottom
D) Hit the top
Stocks rise as they rise from support and fall from resistance. Our goal is to find a low support point and enter. It can be referred to as buying at the pullback point. The pullback point can be found with a Fibonacci extension of 61.80%. This is a step to find entry level. 1) Find a triangle (Fibonacci Speed Fan Line) that connects the high (resistance) and low (support) points of the stock in progress, where it is continuously expressed as a Slingshot, 2) and create a Fibonacci extension level for the first rising wave from the start point of slingshot pattern.
When the current price goes over 61.80% level , that can be a good entry point, especially if the SMA 100 and 200 curves are gathered together at 61.80%, it is a very good entry point.
As a great help, tradingview provide these Fibonacci speed fan lines and extension levels with ease. So if you use the Fibonacci fan line, the extension level, and the SMA 100/200 curve well, you can find an entry point for the stock market. At least you have to enter at this low point to avoid trading failure, and if you are skilled at entering this low point, with fibonacci6180 technique, your reading skill to chart will be greatly improved.
If you want to do day trading, please set the time frame to 5 minutes or 15 minutes, and you will see many of the low point of rising stocks.
If want to prefer long term range trading, you can set the time frame to 1 hr or 1 day.


SQQQLong. I bought at 20.54. I figured might as well ride the wave til it's gone or atleast a day or more. It's already cleared the 20.46 level, it doesn't seem to be going in sideways in a range but going upward now. This is shorting the market of course.

Buckles up traders. SQQQ is telling you something!Long NASDAQ:SQQQ is my trade idea. This beauty has been setting up nicely since last couple of weeks and it seems ready to move up.

SQQQ Attempting a HedgeI entered long SQQQ pre market at $18.55
Having a hedge placed in the event a pullback occurs soon.
Good Luck

SQQQ long entry setupSQQQ could reverse from here ?
1.double divergence
2. TQQQ target hit and could pull back
3. PRZ zone
with tight stop loss


SQQQ Break Trendline LONGSQQQ entered the buy zone, because before this she fell a lot, now she will try to make a squeeze.

This is a meme rightThe reason this TA is a meme is because it's based in reality. When something looks like this and you get excited about a single candle when the trend is EXTREMELY clear, it could be the bottom, sure, but this is not the most likely trade here. Bottom picking has it's merits but not in trending markets, especially when things are asynchronous. Odds are, if markets are to fall IWM, SPY, EQAL, RSP AND QQQ will all do it at once.
We don't have this uniformity at the moment, thus this is a bad setup.
I feel confident that we are at a temporary top in tech, but that doesnt mean that you should slam shorts here. This one day move was probably all that you'll realistically get, maybe two-three days. But things aren't falling in general ATM.

Long SQQQ @ 22.53I am adding onto my previous position. @ 32.50 USD.
With no regulation or reform being put in place of the current financial markets, this is one of my go to's for assets to hedge against the next "black swan" event. It's ignorant to say that the markets can maintain this current rally. Our network sees the signs within almost every continents monetary systems, as well as almost all of the highest capped countries of GDP around the world.
A crisis is on our doorstep and we aren't even confronting it. I'm hard pressed to look at any traditional stocks right now that don't at LEAST provide dividends. I will keep you updated more frequently for now.

Another perspectiveThis looks scary. SQQQ (short of QQQ) is forming a bullish divergence within a wedge. Well, I think Nasdaq is due of a big correction though. I'm packing my things ups before the tsunami runs over me.

SQQQ | Something's Going DOWN | ShortProShares UltraPro Short QQQ seeks daily investment results, before fees and expenses, that correspond to three times the inverse (-3x) of the daily performance of the NASDAQ-100 Index.The fund invests in financial instruments that ProShare Advisors believes, in combination, should produce daily returns consistent with the fund's investment objective. The index includes 100 of the largest domestic and international non-financial companies listed on The Nasdaq Stock Market based on market capitalization. The fund is non-diversified.


SQQQ Bullish DivergenceThe tides could be about to change. The bear market rally is fizzling out and SQQQ RSI is showing some Bullish Divergence.

Watchlist 2023-05-03 $SPY $CHGG $MGM $SQQQ $TQQQ $NCLH AMEX:SPY - not making any significant moves ON as we await the FED policy decision at 2:00 ET. It is widely expected that they will raise another 25 basis points. Here are the scenarios and plan of action.
25 bps hike - because this is the expected scenario, the market has priced this in, since mar 13th, we've gained 30 points in SPY. My bias is that we eventually move lower. However, We will obviously need price to confirm this bias. If we are making lower highs, and the strong moves are in the red bars my bias will be confirmed. Also noting if the market internals below are in favour of shorts. Using NASDAQ:SQQQ to play the short side in this situation.
0 bps pause - this will be exceptionally bullish. Buy the leading tech stocks with high RVOL and high beta. NASDAQ:RIOT NASDAQ:NVDA
I still think this is a possibility because Powell mentioned that the banking crisis has done much of the work already.
25 bps cut - don't see this happening but same idea as o bps but go bigger and hold til EOD.
For further confirmation of a trend day, watch for:
USI:ADD pinned near +\-2000
USI:VOLD ratio over +/- 3
USI:TICK cumulating past 0 wicking to +/-900
NYSE:CHGG - tumbled over 43% or 13.5 ATRs in premarket when it forecasted net revenue below analysts' estimates from weaker customer growth due to a recorded rise in student interest in ChatGPT. Many analysts downgrading the name as well. I think this move is unprecedented and there will be opportunities for a bounce trade. Historical support from 2017 is at 8.80 - which it bounced off of PD. Gapping only 1 ATR in PM but still holding below the 9.80 10.00 res. Today I could see it ranging between theses values which gives plenty of room to play in. But it it breaks 10.00 then it's a sure long play. Next Res at 11.00 and 11.30
NYSE:MGM - over 46.40
NYSE:NCLH - Day 3 continuation over 14.65.


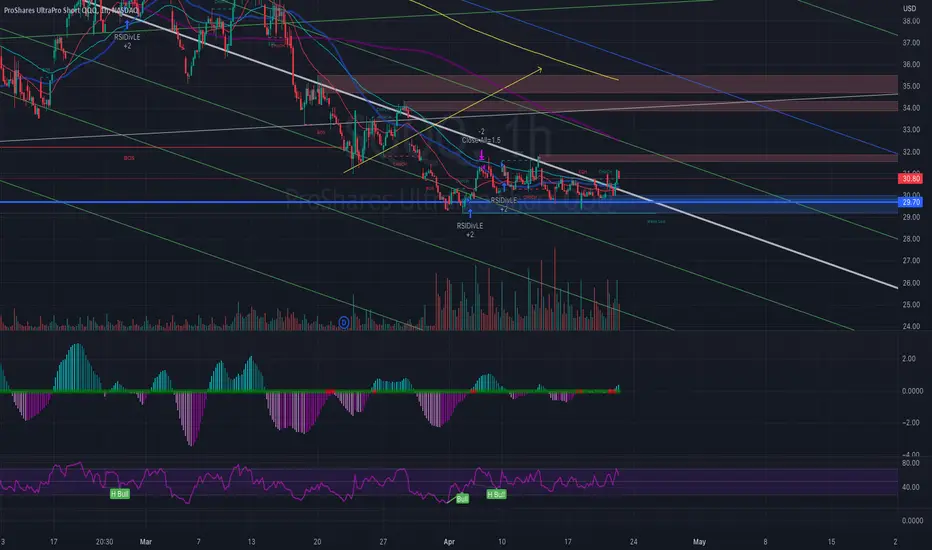
#SQQQ broke out bearish pennant. May Market drop continuous#SQQQ broke out bearish pennant. So if #SQQQ still above 30.3-30.5$, we will see market continue drop until #SQQQ get 31.8-32$