OptionsMastery: Demand Zone for STNG! If we get a break above 38.59 with volume this week on STNG, look for a potential leap trade. Liquidity areas are TP's. (Not financial advice).
STNG/N trade ideas

Time to long it!!!I have no back ground info on this ticker once again and am only going based on technicals.
All indicators point to a pump for about 10-15%. RSI, MACD and my other breathe indicators are pointing up for bullish movement.
Price target 1 is 52

Demand zone for STNG!🔉Sound on!🔉
📣Make sure to watch fullscreen!📣
Thank you as always for watching my videos. I hope that you learned something very educational! Please feel free to like, share, and comment on this post. Remember only risk what you are willing to lose. Trading is very risky but it can change your life!

STNG downside (Daily)STNG has attractive PB, PEG, Sharpe, and Sortino ratios, but it just seems to be aggressively chasing strong historical support...seems like we might see a bounce and a head and shoulders play out

Learning Price Action Through ObservationLearning Happens when you're open and curious and making observations from what you see. From there, you must be mentally balanced to take action on your observations.
In this post, I focus on the price action that happens in the pivot portion of a swing cycle. If you make observations of this area you will see a certain kind of repeating behavior that can help you understand and design methods for trading swings. You will notice that the market likes to wash everybody out of their positions before pivoting to continue its swing.
I have a look at two of the ways this shows up in the price action of a pivot. The first is an engulfing bar that expands and swallows at least 3 of the previous bars. The second is a Gap Swap where there will be a WRB Gap making an effort in one direction just to be followed by another WRB GAP that reverses that effort and direction and shows that the balance of power has shifted.
This is just a small part of what makes up a swing but it factors into my overall methods and trade plan. You can make observations yourself on pivots and see what you can learn.
Shane

STNG Bullish FlagPrice is on a breakout above a bullish flag and is now above 20/50/100/200 EMA. However, momentum is decreasing and RSI is nearly 70. Therefore, STNG may consolidate around 60 resistance level before surging up towards is 72 price target.

SCORPIO TANKERS Stock Chart Fibonacci Analysis 070223 Trading Idea
1) Find a FIBO slingshot
2) Check FIBO 61.80% level
3) Entry Point > 44.5/61.80%
Chart time frame : B
A) 15 min(1W-3M)
B) 1 hr(3M-6M)
C) 4 hr(6M-1year)
D) 1 day(1-3years)
Stock progress : A
A) Keep rising over 61.80% resistance
B) 61.80% resistance
C) Hit the bottom
D) Hit the top
Stocks rise as they rise from support and fall from resistance. Our goal is to find a low support point and enter. It can be referred to as buying at the pullback point. The pullback point can be found with a Fibonacci extension of 61.80%. This is a step to find entry level. 1) Find a triangle (Fibonacci Speed Fan Line) that connects the high (resistance) and low (support) points of the stock in progress, where it is continuously expressed as a Slingshot, 2) and create a Fibonacci extension level for the first rising wave from the start point of slingshot pattern.
When the current price goes over 61.80% level , that can be a good entry point, especially if the SMA 100 and 200 curves are gathered together at 61.80%, it is a very good entry point.
As a great help, tradingview provide these Fibonacci speed fan lines and extension levels with ease. So if you use the Fibonacci fan line, the extension level, and the SMA 100/200 curve well, you can find an entry point for the stock market. At least you have to enter at this low point to avoid trading failure, and if you are skilled at entering this low point, with fibonacci6180 technique, your reading skill to chart will be greatly improved.
If you want to do day trading, please set the time frame to 5 minutes or 15 minutes, and you will see many of the low point of rising stocks.
If want to prefer long term range trading, you can set the time frame to 1 hr or 1 day.

LONG on $STNGBuilding a LONG position on NYSE:STNG at these levels.
1) Continues to build higher free cash flows
2) Transports refined oil products
3) MC currently at $2.4 Bn, valued at $5 Bn presents value
4) Mgmt actively reducing share count = increase share price
5) Recession/OPEC risk
-Support looks solid around $44
- I like $70+ as LT PT ( +60% gain)
-Obviously subject to changes if recession/OPEC screws us
Let me know your thoughts!

$STNG is a stock about to break up!after receiving multiple confirmations I think it is time to buy Scorpio Tankers for a easy $10 gain per stock minimum. Target price is anything between the 59, 60 dollar mark.
However, being part of a triple pike column, you may want to get ready for a second leg from 56-57 to the 72 mark in the near future.
If you make money in this analysis, please like and subscribe to keep creating more of this content! thank you!

Prepare for Impact: Scorpio Tankers Approaching Free FallScorpio Tankers Inc. (STNG) appears to be headed for a downside based on two significant factors - the impact of the oil market and the approach of Wave 3 in the Elliott Wave Theory. The recent downturn in the oil market has hit the entire industry hard, and Scorpio Tankers is no exception. As a company that operates in the oil tanker shipping industry, the drop in oil prices and demand for oil transportation services will have a significant impact on its revenue and earnings. Additionally, from a technical analysis perspective, Scorpio Tankers is approaching Wave 3 of the Elliott Wave Theory. After touching the 0.786 Fibonacci retracement of Wave 2, the stock saw a sharp decline, indicating that Wave 3 may be on the horizon. Based on this analysis, investors should look for the price of Scorpio Tankers to head towards the range of TASE:47 - TASE:43 in the near future.

$STNG, good fundamentalsScorpio Tankers Inc., together with its subsidiaries, engages in the seaborne transportation of refined petroleum products in the shipping markets worldwide.
Management has been aggressively buying back shares
Strong earnings should allow management to continue dividend payments
Strong return over the last month
Prominent player in the Oil, Gas & Consumable Fuels industry
B.Riley analyst raised the price target on Scorpio Tankers (NYSE:STNG) to $80.00 (from $65.00)

$STNG Head & Shoulders Target $39.00I was kind of intuitively guided to this one and have been thinking it's heading down. Looks ready to break the neckline and my dowsing says energy is really bearish.
I asked for a target within the next month and am looking in the zone of $38-40.00

STNG - Scorpio Tankers - Up 350% over 12 monthsScorpio Tankers and its subsidiaries are involved in the seaborne transportation of refined petroleum products in global shipping markets.
Its stock price has had a 350% run so far over the last 12 months, and analysts are forecasting it could get to around $68 or so which is another 20% to go from its current price levels.
There are a couple of different pullback type areas where you might be able to get in for better value depending on your strategy that I have identified on the chart above.
Could be worth a look.

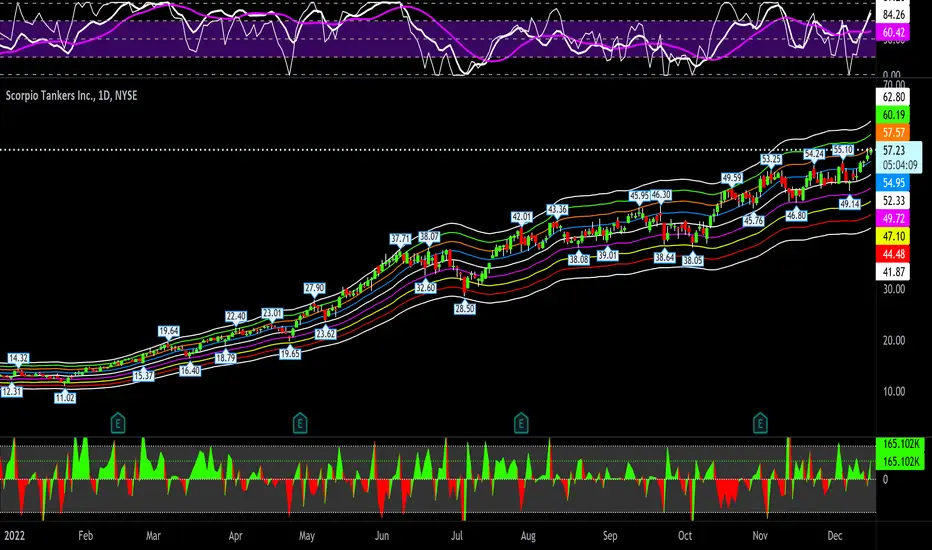
STNG levelsSTNG levels on the 1-day chart:
SMA20 Triangular Trend Channel:
top = $62.80
R3 = $60.19
R2 = $57.57
R1 = $54.95
pivot = $52.34
S1 = $49.72
S2 = $47.10
S3 = $44.49
bottom = $41.87
Do your own due diligence, your risk is 100% your responsibility. This is for educational and entertainment purposes only. You win some or you learn some. Consider being charitable with some of your profit to help humankind. Good luck and happy trading friends...
*3x lucky 7s of trading*
7pt Trading compass:
Price action, entry/exit
Volume average/direction
Trend, patterns, momentum
Newsworthy current events
Revenue
Earnings
Balance sheet
7 Common mistakes:
+5% portfolio trades, capital risk management
Beware of analyst's motives
Emotions & Opinions
FOMO : bad timing, the market is ruthless, be shrewd
Lack of planning & discipline
Forgetting restraint
Obdurate repetitive errors, no adaptation
7 Important tools:
Trading View app!, Brokerage UI
Accurate indicators & settings
Wide screen monitor/s
Trading log (pencil & graph paper)
Big, organized desk
Reading books, playing chess
Sorted watch-list
Checkout my indicators:
Fibonacci VIP - volume
Fibonacci MA7 - price
pi RSI - trend momentum
TTC - trend channel
AlertiT - notification
tickerTracker - MFI Oscillator
www.tradingview.com
What is happening in the Oil & Gas-Transport/Pipelne Group?Several stocks of this industry are making new highs
And NYSE:STNG and NYSE:INSW are leading the way.
Something must be happening here.
I missed entries in these stocks but I'll keep them in the watchlist as they are clear market leaders.

STNG -- Long--Hold on the long support
--Reclaim the 21 ema
--Breakout from a flag pattern , showed entry on MACD , RSI above 50
--Entry 1.25%-2% above last close price
--Cut loss @ 7.5% (at higher range), right below 21 ema , since this could be the support level . Above 2:1 target ratio
--Disregard if show choppy price action
--Good luck, hope there still demand for marine transportation
--CPI report tomorrow on 10/13, stocks most likely react to the report.

STNG - LONGSTNG - Long
Scorpio Tankers is one of the top Energy Transportation plays
Given the Russia Ukraine situation - rates could well remain elevated
Paying off debt of $500m + $250m share buyback (relative to a $2bn market cap this is significant!)
Management has invested in heavily ships in prior years - giving it a very young fleet (6.5 yrs avg) - as a result management has no plans to purchase/replace ships anytime soon (mentioned on earnings call) - This should free up cashflow
Could see another retest of that $37.50 area, but I'm happy to try for a position now

STNG ShortHi there,
Currently expecting fourth wave (correction) to 38.2% from the previous upward movement.
Since the fourth corrective wave is expected further (when the price will reach the target) I will consider the final upward movement as a final fifth wave.

stngshort base but not much else too look at yet.................................................................................

Trading Idea - #ScorpioTankersMy Trading Idea for Scorpio Tankers - sell / SHORT
Target: 20.00 EUR
Stop: 41.50 EUR
Resistance level rejected. I'll give it a try to retrace to POI at 20.00 EUR!

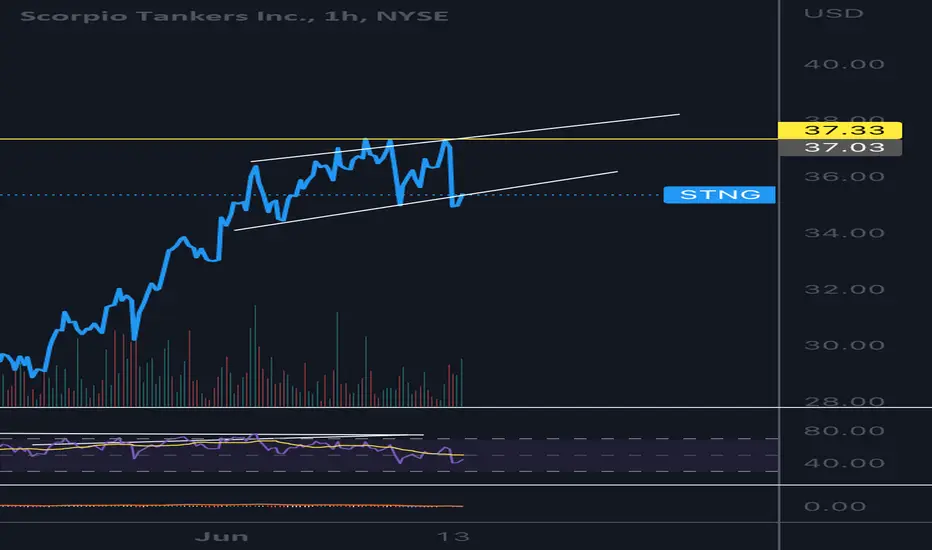
STnG Been on a huge parobolic run. Could b just a minor pull back here Howver daily is showing a double top at that 37 level. I see a potential head and shoulders and a rising channel here. I’m really watching this 35.40 area of course if it pops back in it this means nothing. So we’ll have to wait and see if we can see any rejection here. Otherwise watchinf that 37$ range again. If we do see further rejection in this 35.45 area we may be starting the first sign of a breakdown. Def have to trade this super catious as it’s been very very strong and would suck to be on the wrong aide of it
Long scalp STNGBased on its uptrend, rebound from support and a familiar chart pattern confirmed by my technical indicators, I expect at least half a percent in profits IF STNG exceeds yesterday's high of $26.14 during today's session.

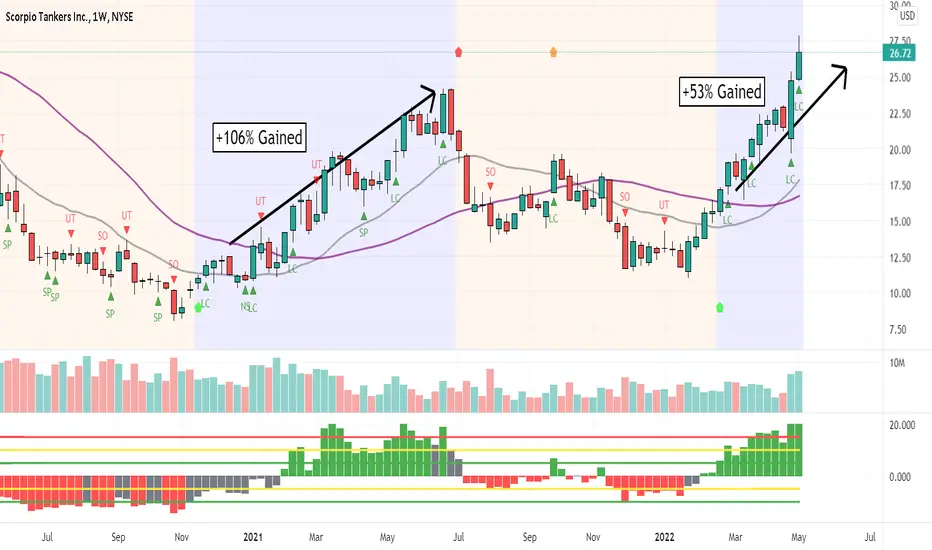
STNG - Uptrend Continue without DistributionSign of Strength in the chart:
1. Mark-up stage after Accumulation
2. Strong uptrend with Bullish Signal in weekly chart
3. Healthy Pullback in daily chart
Disclaimer
This information only serves as reference information and does not constitute a buy or sell call. Conduct your own research and assessment before deciding to buy or sell any stock