Daily T stock trend forecast analysis19-JUL
www.pretiming.com
Investing position: In Falling section of high risk & low profit
S&D strength Trend: In the midst of a downward trend of strong downward momentum price flow marked by temporary rises and strong falls.
Today's S&D strength Flow: Supply-Demand strength has changed from a weak selling flow to a strengthening selling flow again.
Forecast D+1 Candlestick Color : RED Candlestick
%D+1 Range forecast: 0.5% (HIGH) ~ -0.6% (LOW), -0.1% (CLOSE)
%AVG in case of rising: 1.0% (HIGH) ~ -0.4% (LOW), 0.6% (CLOSE)
%AVG in case of falling: 0.3% (HIGH) ~ -1.1% (LOW), -0.8% (CLOSE)
T trade ideas
AT&T (T) sell signalsAT&T (T), Daily chart: 1 year long resistance zone + Side of Bollinger bands (20,2) + Overbought on RSI(14)

T: EX-DIVIDEND PLAY! 7/8/19ex-dividend play
T offering $0.51 dividend, therefore, in theory, the price of the stock will drop in the AM by such amount.
Expect it to drop down around to 33.67, which is the next support line. If it does go down more, expect it to drop around to 33.00.


Daily AT&T T forecast analysis for stock investing strategies03-Jul
Price trend forecast timing analysis based on pretiming algorithm of Supply-Demand(S&D) strength.
Investing position: In Rising section of high profit & low risk
S&D strength Trend: In the midst of an upward trend of strong upward momentum price flow marked by the temporary falls and strong rises.
Today's S&D strength Flow: Supply-Demand(S&D) strength flow appropriate to the current trend.
read more: www.pretiming.com
D+1 Candlestick Color forecast: GREEN Candlestick
%D+1 Range forecast: 1.4% (HIGH) ~ 0.1% (LOW), 1.0% (CLOSE)
%AVG in case of rising: 1.2% (HIGH) ~ -0.2% (LOW), 0.9% (CLOSE)
%AVG in case of falling: 0.4% (HIGH) ~ -1.2% (LOW), -0.6% (CLOSE)
Daily T(AT&T) forecast timing analysis by Supply-Demand strength21-Jun
Investing strategies by pretiming
Investing position about Supply-Demand(S&D) strength: In Falling section of high risk & low profit
Supply-Demand(S&D) strength Trend Analysis: In the midst of a downward trend of strong downward momentum price flow marked by temporary rises and strong falls.
Today's S&D strength Flow: Supply-Demand strength has changed from a weak selling flow to a suddenly strengthening selling flow.
View a Forecast Candlestick Shape Analysis of 10 days in the future: www.pretiming.com
(You can easily create a trading plan.)
D+1 Candlestick Color forecast: RED Candlestick
%D+1 Range forecast: 0.0% (HIGH) ~ -1.6% (LOW), -1.0% (CLOSE)
%AVG in case of rising: 1.0% (HIGH) ~ -0.4% (LOW), 0.6% (CLOSE)
%AVG in case of falling: 0.4% (HIGH) ~ -1.1% (LOW), -0.8% (CLOSE)
Price Forecast Timing Criteria: Price forecast timing is analyzed based on pretiming algorithm of Supply-Demand(S&D) strength.


BAC short terms pull backFrom a newbie's POV on support and resistance. Looking at BAC to have some pull back this week towards the 30.1 range.


Great Iron Butterfly Set-upWith Implied Volatility not exactly high, $T is setting up for an iron butterfly over just a straight short straddle. Dashed black lines indicate the breakeven points for the JUL19 28/32/36 Iron Butterfly.

AT&T - Long2nd Resistance: $43
1st Resistance: $37
Resistances:
Monthly Chart
Supports:
1st Support: $28
2nd Support: $20

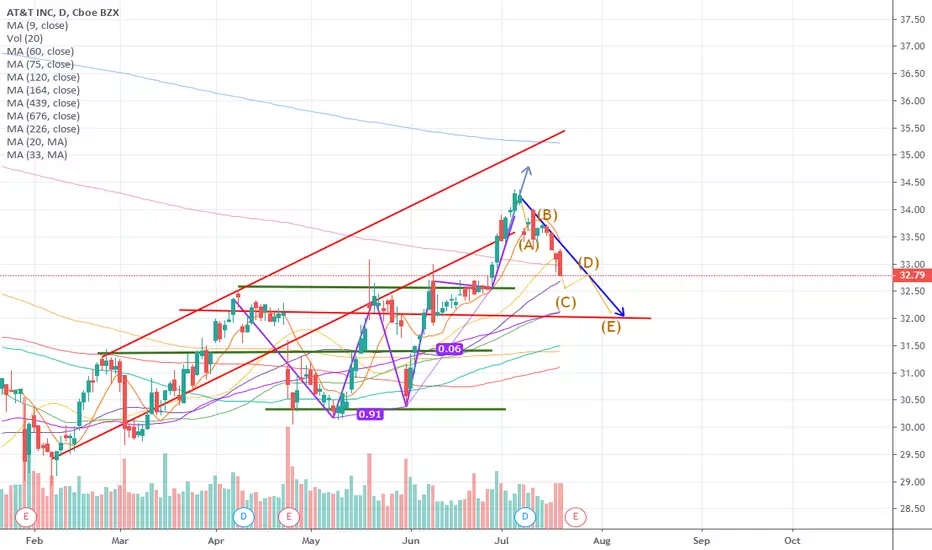
AT&T fantastic entry coming soonThis is just one possible count. The last ABC you see in this chart could just be an A (only), so I'll update the count if wrong, but if right = gains!
This chart make Fibonacci love all over the place. Not many stocks/equities are this responsive. (That's why <3 trading crypto) Also: There's truncations all over this chart. If you aren't good at elliot wave yet, this chart would likely defeat you. If you have practice, and notice all the truncations = mad bullish stock!
First count I'll probably post another later but GOD D!#$% good R:R on this one!


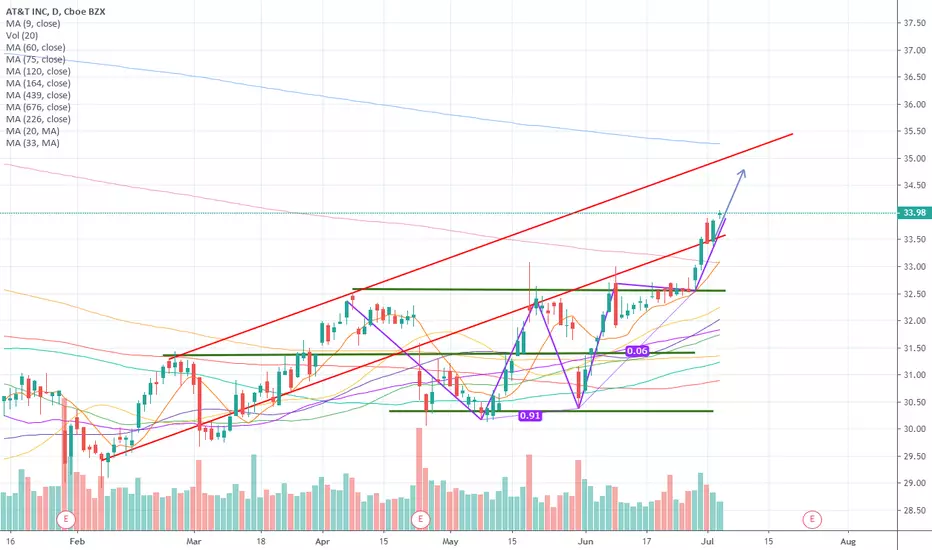
Long Term Hold - Great Entry in the low $30s and belowVolume spiked in the past year while it is trading in an ascending triangle.
T has great dividend yield along with 5G as the catalyst for growth.

$T It's just a little depressing at AT&T. There is not a great deal to rejoice at AT&T presently, cord cutting and in particular the over payment for Warner Media is dark cloud hanging with no silver lining. Last weeks earnings was no confidence booster either nor the public performance of the CEO whom can often be portrayed as lacking enthusiasm and optimism. The stock price is stuck in a downward channel and we can't see this coming to a end soon. The only positive is the adoption of 5G which could be real stimulus to the company but that is just in the fledgling stages.


T Breakout ScenarioBrowsing the financial new sections, one company name keeps standing out to me. AT&T.
I have taken note of a few key factors. First, their acquisition of Time Warner caught my eye. Second, they have a modest P/E of 11.46x, and a current EPS of 2.771. Aside from the ratios, the company generates strong operating margins and huge free cash flows.
The price has been oscillating in the $30 range of late, moving mostly sideways. I believe that T is breaking out of the recent trend on strong volume, as modeled with a linear regression. I believe the stock could break the .786 mark and move to the fib level 1 very soon.
Something to possibly keep an eye on.

Pin candle on neckline supportThis is the retest I was waiting for: a few days ago I posted an idea on #T highlighting a broken head and shoulders pattern. Today's candle loos like the perfect retest of the old resistance as new support.
Today's pin candle shows buyers' pressure around $31.50 and this seems a perfect area to go long; as always, evaluate this trade based on your risk aversion and money management.

T did something exciting!So last night I said that AT&T was going to rally to 32.45. It was looking good with gains and natural consolidation, but it looks like it wigged out finally. it got near the 32.45 marker and then dropped to open at 31.78. We are inside my pitchfork again (unfortunately), but with the patterns we've been seeing we will most likely see a bounce back up sooner or later around 31.35. If this is correct, AT&T will most likely reach 32.45 within the month.
More to come later.

AT&T possible rally to 32.45 - 32-50AT&T is looking solid for a rally within 6:30 - 9:15 AM (PST) tomorrow. Showing signs of major bull signals so watch for 32.45 to become a solid support after the rally.


T Trend violatingWrite sometning about your psyhology thinking before trade? Ok nice after beeing into forest
Describe the trade. What you see? there is a dowturn trend from january and I will try to catch one leg.
What have I done well for this trade? Exelent enter point according to down trend
What can I take away to help with later trades? That you should sell after the trend is violated. move your stop to the level of trend line.
