AT&T (T) - dividend champion with 5,1% dividend payoutHere is another dividend champion with a payout of 5,1% per share.
Fair value: 43$ currently trading at 38$
Rating BBB+, 47% long term debt, yearly dividend increase of 4%
T trade ideas

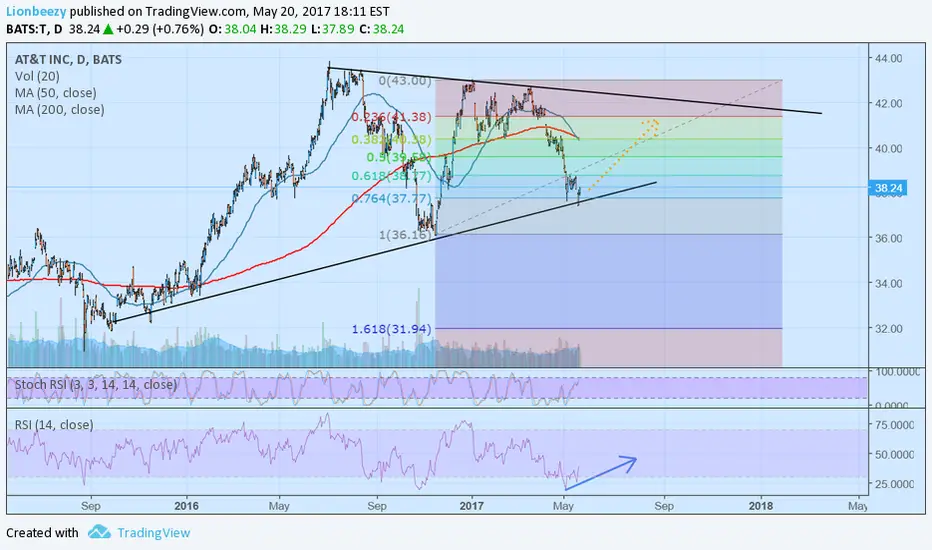
AT&T (T) is targeting 41AT&T NYSE:T is near a support, if the movement continues inside the triangle, then it is expected to target 41.


T - POTENTIAL BOTTOM08.05.17
Signal of a potential bottom from my dBFIr on DAILY chart
Awaiting confirmation


AT&T revenues dip as wireless equipment sales slideAT&T (T -0.2%) is up 1.2% now in choppy early postmarket action after reporting Q1 earnings that met profit expectations but recorded a billion-dollar miss on revenues.
Consolidated revenues slipped 2.8% on "record-low equipment sales" in wireless. EPS fell on a headline basis, but adjusted EPS grew to $0.74 (in line) from a year-ago $0.72.
Cash from operations was $9.2B; free cash flow came to $3.2B.
Revenues by segment: Business Solutions, $16.85B (down 4.3%); Entertainment Group, $12.6B (down 0.3%); Consumer Mobility, $7.74B (down 7.1%); International, $1.9B (up 15.7%).
It added 2.7M net wireless customers: 2.1M in the U.S. and 633,000 in Mexico. Postpaid phone churn hit a best ever 0.9% in the U.S., while overall wireless postpaid churn was 1.12% including tablet churn.

AT&T Still FallingOn April 13, 2017, AT&T ( NYSE:T ) crossed below its 150 day moving average (DMA). Historically this has occurred 223 times and the stock does not always drop. It has a median loss of 3.679% and a maximum loss of 21.351% over the next 20 trading days.
When we take a look at other technical indicators, the relative strength index (RSI) is at 32.0245. RSI tends to determine trends, overbought and oversold levels as well as likelihood of price swings. I personally use anything above 75 as overbought and anything under 25 as oversold. The current reading declares the stock is trending down and could enter oversold territory soon.
The true strength index (TSI) is currently -12.2241. The TSI determines overbought/oversold levels and/or current trend. I solely use this as an indicator of trend as overbought and oversold levels vary. The TSI is double smoothed in its calculation and is a great indicator of upward and downward movement. The current reading declares the stock is moving down.
The positive vortex indicator (VI) is at 0.8389 while the negative is at 1.1199. When the positive level is higher than 1 and higher than the negative indicator, the overall price action is moving upward. When the negative level is higher than 1 and higher than the positive indicator, the overall price action is moving downward. The current reading declares the stock has been moving down, but the pace is slowing. Also the positive indicator is beginning to rise meaning price action could slow in the short-term leaving the door open for a price change in either direction.
The stochastic oscillator K value is 14.0197 and D value is 11.0155. This is a cyclical oscillator that is highly accurate and can be used to identify overbought/oversold levels as well as pending reversals and short-term activity. I personally use anything above 80 as overbought and below 20 as oversold. When the K value is higher than the D value, the price action is trending up. When the D value is higher that the K value the price action is trending down. The current reading declares the stock is in oversold territory, but it has been flirting around this point since the end of March.
Considering the moving average crossover, RSI, TSI, VI and stochastic levels, the overall direction appears to continue heading down. Based on historical movement compared to current levels and the current position, the stock could drop another 2% over the next 20 trading days. AT&T has crossed the 150 DMA in three of the last four sessions. The most recent similar flirtations with the 150 DMA have occurred in October 2014, November 2014, February 2015, August 2015, January 2016, and September 2016. The losses were 4.776%, 8.083%, 5.684%, 8.101%1.328%, and 4.355% respectively. This drop could ultimately result in a loss of nearly 4% to the bottom of the macro trend line (thick yellow line) 38.50-38.75 range, but the conservative play is around 39.40.

T Entering reversal zoneAT&T is entering its reversal zone and is gearing up for a good long play.
Symbol: T
Position: LONG via May 19 41 CALL options
- April 17 41 too close for comfort and April 17 40.5 does not have enough open interest
Justification: Bull reversal zone
Strategy:
Wait for candlestick indicators of reversal (hammers, engulfment, etc) that are supported with chart indicators (RSI movement, cloud break on 15 minute chart, etc).
15 minute chart also showing a clear wedge formation, so a break of this wedge would also serve as further confirmation.
Enter long upon confirmation of these signals.
.


Buy The Coming Dip For AT&TOn March 31, 2017, AT&T ( NYSE:T ) crossed below its 50 day moving average (MA) while its 100 day MA crossed over the 200 day MA. Both events have never occurred on the same day. Historically the stock has crossed below the 50 MA 330 times and the stock does not always drop. It has a median loss of 2.239% and maximum loss of 25.170 % over the next 8 trading days. Historically the 100 MA has crossed over the 200 MA 20 times and the stock does not always rise. It has a median gain of 3.959% and maximum gain of 21.067 % over the next 20 trading days.
When we take a look at other technical indicators, the relative strength index (RSI) is at 45.0401. RSI tends to determine overbought and oversold levels. I personally use anything above 75 as overbought and anything under 25 as oversold. The current reading declares the stock is slightly moving down.
The true strength index (TSI) is currently 3.9504. The TSI determines overbought/oversold levels and/or current trend. I solely use this as an indicator of trend as overbought and oversold levels vary. The TSI is double smoothed in its calculation and is a great indicator of upward and downward movement. The current reading declares the stock is slightly moving down.
The negative vortex indicator (VI) is at 1.0906. When the positive level is higher than 1 and higher than the negative indicator, the overall price action is moving upward. When the negative level is higher than 1 and higher than the positive indicator, the overall price action is moving downward. The current reading declares the stock is moving down.
The stochastic oscillator K value is 22.22 and D value is 18.62. This is a cyclical oscillator that is highly accurate and can be used to identify overbought/oversold levels as well as pending reversals. I personally use anything above 80 as overbought and below 20 as oversold. When the K value is higher than the D value, the stock is trending up. When the D value is higher that the K value the stock is trending down. The current reading declares the stock is coming out of an oversold level, meaning the stock should go higher in the next few days.
Considering the moving average crossover, RSI, TSI, VI and stochastic levels, the overall direction appears to be heading down in the very short term, but up in the long term. Based on historical movement compared to current levels and the current position, the stock could lose another 1% over the next 5 trading days. After this drop, the stock could move up toward the resistance level around 42.50. From the close on March 31, the stock could gain 2% within the next four weeks. If bought near the anticipated dip, the gain could be greater than 3.5%.


AT&T at descending triangle resistance lineAT&T is currently forming a descending triangle pattern (look at weekly / daily charts for confirmation). It is also at the resistance line for the descending pattern on the hourly chart.
Wait for break of convergence pattern below and then enter short. Set your stop loss slightly above the middle of the convergence pattern to avoid false breakouts, and set your price target slightly above resistance to avoid missing your exit.


