Tesla Stock Continues to Trade Within a Bearish ChannelThe monthly movements of Tesla's stock continue to reflect persistent downward pressure, with a decline of just over 10% since the beginning of March, showing steady selling interest. The bearish sentiment has remained in place as growing discontent over Elon Musk's political positioning has damaged the brand's image, while concerns over a potential trade war have raised fears that Tesla’s international sales may be negatively affected.
Bearish Channel:
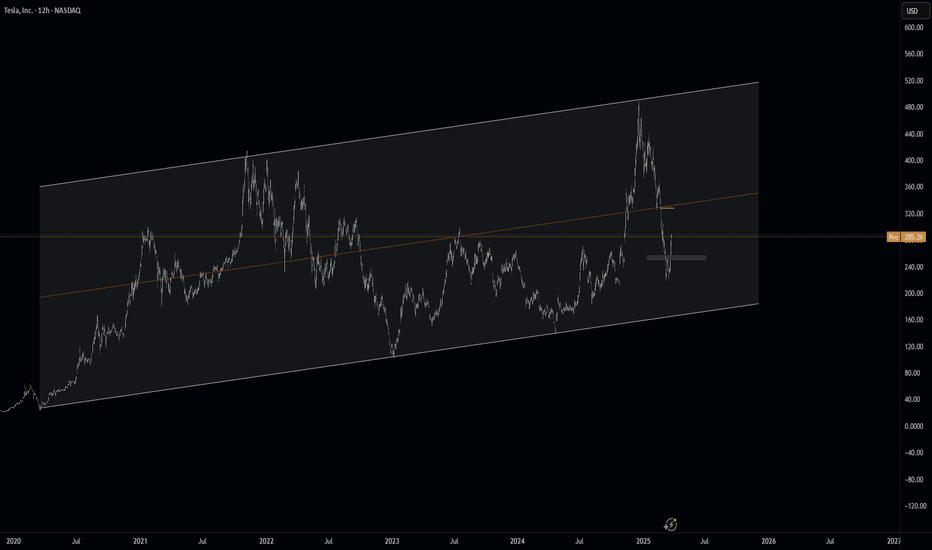
Currently, the most important formation on the chart is a strong bearish channel that has remained intact since the final days of December 2024. So far, recent bullish attempts have failed to break out of this structure, reinforcing the broader bearish bias in the long-term outlook.
MACD Indicator:
The latest movements in the MACD histogram have started to show a notable decline, indicating that momentum in the moving average trend may be fading in the short term. This is likely due to the price reaching the upper boundary of the bearish channel, where resistance remains strong.
ADX Indicator:
The ADX line is currently trending downward, hovering just above the neutral 20 level. As this pattern continues, it reflects a lack of strength in recent price movements, pointing to growing indecision, which in turn reinforces the current resistance zone where the price is consolidating.
Key Levels to Watch:
$290: A significant resistance zone, aligning with the top of the bearish channel and the 200-period moving average. Sustained buying above this level could threaten the current bearish structure and signal the start of stronger bullish pressure.
$220: A key support level, representing the recent lows in the stock. A clean break below this zone could confirm a stronger bearish trend, opening the door for more aggressive selling in the sessions ahead.
By Julian Pineda, CFA – Market Analyst
TSLA trade ideas
Tesla - There Is Hope For Bulls!Tesla ( NASDAQ:TSLA ) is just crashing recently:
Click chart above to see the detailed analysis👆🏻
After Tesla perfectly retested the previous all time high just a couple of weeks ago, we now witnessed a quite expected rejection of about -50%. However market structure remains still bullish and if we see some bullish confirmation, a substantial move higher will follow soon.
Levels to watch: $260, $400
Keep your long term vision!
Philip (BasicTrading)
TeslaHaters better get it in quick, because TSLA just retraced the breakout of the prior overhead. It can and probably will pump from here, because Tesla short interest remains too high. Is anyone even raise an eyebrow that Trump’s tariffs barely scathed Tesla, but hurts most other car brands, even other “American” brands. The candles don’t care if you hate Elon or not.
What Is Tesla’s Fundamental and Technical Analysis Showing?EV maker Tesla NASDAQ:TSLA is perhaps the most controversial stock in U.S financial markets right now. Sales appear to be slowing, while CEO Elon Musk's position as a Trump administration adviser has led political opponents to attack Tesla vehicles, dealerships and even some vehicle owners.
TSLA popped 11.9% on Monday (March 24), but has generally been sinking for months. What does technical and fundamental analysis say might happen next?
Let's dig in and see what we find:
Tesla’s Fundamental Analysis
TSLA rose almost 95% in the roughly seven weeks between Donald Trump’s November election victory and the stock’s $488.54 all-time intraday high on Dec. 18. After all, Musk’s close ties to Trump seemed to point to good times ahead for the company.
However, the stock’s price has been in decline ever since then, while vandalism of Tesla vehicles by Trump opponents has made owning or one a slightly risky affair.
As of this writing, TSLA was down 32.2% year to date and 44% from the stock's Dec. 18 peak.
Beyond politics, a lot of this had to do with the reality that demand for electric vehicles might have hit something of a saturation point, at least for now.
There’s also been a tremendous increase in competition in recent years for electric-vehicle purchases or leases. Volkswagen OTC:VWAGY has ramped up its EV efforts, while China is absolutely full of homegrown competitors like BYD OTC:BYDDF , Nio NYSE:NIO and XPeng NYSE:XPEV .
All in, Tesla’s vehicle sales have slackened not just in America, but also in Europe and China. But to be fair, Ford NYSE:F , General Motors NYSE:GM and Rivian NASDAQ:RIVN have all hit slowdowns in EV sales as well.
Still, add it all up and Wall Street is looking TSLA to report Q1 results in May that include $0.47 of adjusted earnings per share on $22.9 billion of revenue.
That would represent 4.4% larger earnings and about 7.5% higher revenues when compared to last year’s Q1, where Tesla reported $0.45 of adjusted EPS on $21.3 billion in revenues.
However, all 13 sell-side Tesla analysts that I can find have revised their quarterly estimates lower since current quarter began.
On the bright side, the automaker’s operating and free cash flows have remained strong for the past three quarters.
The firm ended 2024 with some $36.6 billion in cash against a $13.6 billion total debt load. That’s what many would consider a strong balance sheet that could sustain Tesla’s operations for a time if need be.
Tesla’s Technical Analysis
A look at Tesla’s one-year chart shows that while the stock has been falling since December, it still managed to make a stand technically in recent days:
The purple line at right in the above chart shows that TSLA found support twice in March very close to $212.30. That’s the 78.6% Fibonacci retracement level of the stock’s entire April 2024 to December 2024 run.
That purple line also shows indicates that Tesla has formed a small “double bottom” pattern of what could be a bullish reversal at the Fibonacci support level, and that the stock has since tried to rally from there.
TSLA was also able to recently take back its 21-day Exponential Moving Average (or “EMA,” denoted by the green line above). However, the stock appears to have hit resistance at the 200-day Simple Moving Average (or “SMA,” marked above with a red line).
That makes the 200-day SMA the stock's likely new pivot point.
A retaking of the 200-day SMA would allow for increased target prices. Conversely, a retest and loss of Tesla’s 78.6% Fibonacci retracement level could permit a further decline.
Meanwhile, Tesla’s Relative Strength Index (the gray line in the above chart’s top) has mostly improved recently and now stands in neutral territory.
Similarly, the stock’s daily Moving Average Convergence Divergence indicator -- or “MACD,” denoted by the black and gold lines and blue bars at the chart’s bottom -- is in a less-awful place than it was earlier this year.
The histogram of Tesla’s 9-day Exponential Moving Average (or “EMA,” denoted by the blue bars at the chart’s bottom) is now above zero. That’s historically a short-term bullish sign.
Similarly, the stock’s 12-day EMA (the black line at the bottom) is now above its 26-day EMA (the gold line). That’s typically somewhat positive, but both of those lines are still below zero -- which is historically a negative signal.
(Moomoo Technologies Inc. Markets Commentator Stephen “Sarge” Guilfoyle had no position in TSLA at the time of writing this column.)
This article discusses technical analysis, other approaches, including fundamental analysis, may offer very different views. The examples provided are for illustrative purposes only and are not intended to be reflective of the results you can expect to achieve. Specific security charts used are for illustrative purposes only and are not a recommendation, offer to sell, or a solicitation of an offer to buy any security. Past investment performance does not indicate or guarantee future success. Returns will vary, and all investments carry risks, including loss of principal. This content is also not a research report and is not intended to serve as the basis for any investment decision. The information contained in this article does not purport to be a complete description of the securities, markets, or developments referred to in this material. Moomoo and its affiliates make no representation or warranty as to the article's adequacy, completeness, accuracy or timeliness for any particular purpose of the above content. Furthermore, there is no guarantee that any statements, estimates, price targets, opinions or forecasts provided herein will prove to be correct.
Moomoo is a financial information and trading app offered by Moomoo Technologies Inc. In the U.S., investment products and services on Moomoo are offered by Moomoo Financial Inc., Member FINRA/SIPC.
TradingView is an independent third party not affiliated with Moomoo Financial Inc., Moomoo Technologies Inc., or its affiliates. Moomoo Financial Inc. and its affiliates do not endorse, represent or warrant the completeness and accuracy of the data and information available on the TradingView platform and are not responsible for any services provided by the third-party platform.
TSLA what's wrong? no supercharger in sight? 2 things i need to say
Technicals
- TSLA has a Elliot wave in motion, so far it respected the sequence,
1H - divergence (But no resistance in sight) - caution
if if settles below 270 , then we might see 221 or even lower?
Fundamentals
I'm not even going to mention the popularity loss of TSLA since Elon meddled into politics, but the recent Auto tariffs President Trump imposed? - well... TLSA makes cars, needs auto parts, ... you get the point
Remember to take the risks into consideration and always do your own analysis before taking a decision !!
I'm still new to sharing ideas on the community - don't start throwing rocks now :D
-Not financial Advice !
TSLA Setup: Tariffs & Technicals Aligned?????Current Price: $273.13
Key Resistance: $278 (for now 👀)
Support Zone: $235
Short-Term Target: $310+
Vibe Check: Ultra Bullish 💥
🧨 Tariffs ? Tesla Just Became the Favorite
April 2nd — 25% tariffs hit every imported car in the U.S. market. But guess who builds all their U.S. cars domestically?
✅ Tesla.
✅ Not Toyota. Not VW. Not GM.
✅ Tesla.
While the competition scrambles to raise prices, cut margins, or shift production — TSLA is sitting pretty, ready to scoop up market share like it's candy.
This is a massive macro tailwind that nobody's pricing in... yet.
📈 The Chart Is Screaming...
TSLA is coiling under resistance at $278 like a spring-loaded beast.
💥 Breakout from $278 = rocket ignition
💥 Next stops? $305 → $320 → $350 isn't out of the question
💥 Above $310, the FOMO is going to be unreal
Support at $235 has held beautifully — that’s the launchpad. The current move is setting up like a classic bullish breakout fakeout bait. Everyone who's sleeping? Might regret it.
🔭 What Could Fuel the Fire:
🚘 Tariff catalyst goes live April 2
🔋 Q1 delivery numbers — potential upside surprise
🐂 Analysts already raising price targets quietly
💬 Elon tweet away from a +$20 candle
📉 Shorts might get cooked 🔥
🧠 Final Take:
TSLA is staring down a macro tailwind, a technical breakout, and a sleeping market. This isn’t just a trade — this could be the next leg of a major run.
"Resistance at $278? Cute. Let’s call it a launch barrier."
Next stop? $310+. Moon mode is fully engaged. 🌝
📌 Not financial advice, but the chart, the macro, and the momentum?
Yeah… it’s looking REAL spicy . 🌶️
Tesla (TSLA) - The Big Short?Can Tesla save itself from the Big Short? With earnings coming up on April 29, the anticipated sales and earnings may be dismal. If hedge funds and retirement managers decide to lighten their exposure, this could lead to abrupt moves in the price of Tesla. Basically, if people want to sell and no one wants to buy at this price, then price has to go down. Also if Tesla hits a certain price on the way down, then all the loans like those used to purchase Twitter may margin call due to risk, more selling. This would not be good for Tesla or the market in general. Also keep in mind that April may be a pullback month for the S&P500 and Nasdaq anyway. So, what does Tesla need to do to combat this? 1. Deliver new products or announce the delivery of new product. 2. Deliver on full self driving along with the Robo Taxi service 3. Deliver on a new cheaper Tesla Model that can be used by individual owners to participate in the Robo Taxi network (Income for the buyer). 4. Deliver on a redesigned Cyber Truck. The current design in getting banned in European countries. Therefore, missing out on sells. 5. Deliver on mass productoin of humanoid robots and AI agents (someone has to be first). This will create excitement but can be tricky since it will unleash AI on the world which can be great but also introduce risk that have not been vetted. Such as, who controls the AI? Who is the AI 'loyal' to? What can people or Tesla ask AI to do? Are there morality rules? Is AI subject to the law? Who's laws based on the Country, State, or county/city it resides or where it was manufactured? 6. Advertise all the positive things about Tesla as a company and the cars as a product. Explain why someone should buy a Tesla over a BYD brand electric car in markets around the world.
These are just a few suggestions for Tesla to avoid The Big Short. What are some of your ideas?
TSLA Q1 FY25 : ich kann buy somewhere from 334 to 579 im expecting a nosedive maybe 334 all in all im just gonna catch some yields on my options
well cars being burnt down might discourage people from buying in the long run but this meme stock has many factors like the musk cult that dont realisr he trollin em with all these salutes and haircuts and german party endorsements this counts as public sentiment that will eventually whiplash the brands image so im not too confident it will make a complete impulse ill buy the dip on all tech till nasdaq hits 23.5k
Tesla sideways3month candle about to close on tesla, if there is a buy to push it up past the top of the previous 3m high (which is pretty far fetched) i predict that there will be another 3 months of sideways action on tesla which would assume there would be the same on nas and snp
no buy signal atm have to see what the next 3m does but i assume there will be a lower wick on the next month.
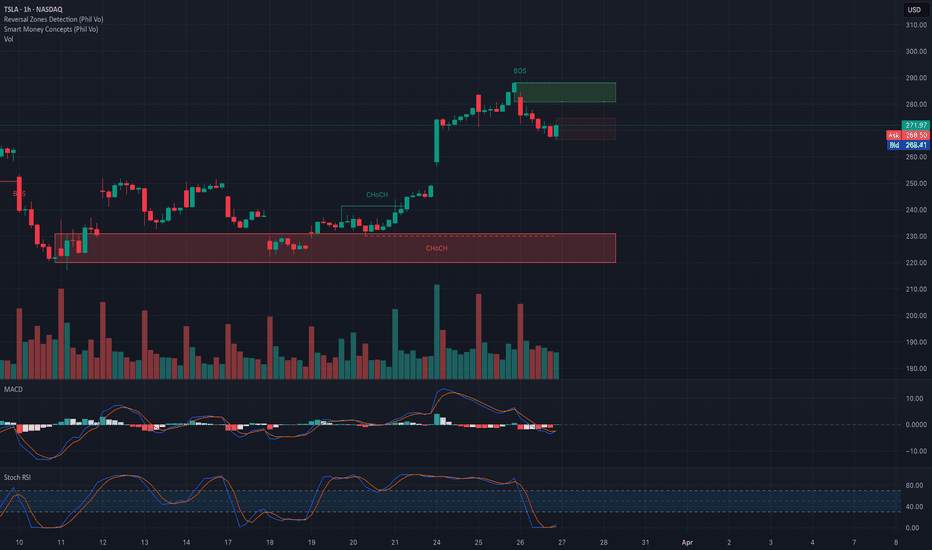
TSLA Reversal or Continuation? Gamma Magnet at Work – Watch This ⚠️ Technical Analysis (TA) – Intraday Setup
Current Price Zone: ~$268.41
* TSLA recently broke structure to the upside (BOS) after a strong rally from the previous CHoCH zone near $230–240.
* After tapping into the supply zone at $282–288, price has pulled back toward $267–268.
* Still trading above all major recent swing lows and inside a potential retracement zone.
Indicators:
* MACD: Bearish cross, momentum slowing after breakout.
* Stoch RSI: Oversold, suggesting a possible bounce opportunity.
🔐 Key Zones
Support Levels:
* 267.50–268.00 → HVL + consolidation zone; key intraday pivot.
* 255 → Strong demand / GEX support zone.
* 250 → PUT wall and prior consolidation base.
Resistance Levels:
* 282.5–288 → Supply zone + 2nd CALL Wall.
* 300 → Gamma Wall and highest positive GEX — strong resistance unless momentum breakout.
🧠 GEX & Options Flow (TanukiTrade Sentiment)
* GEX Sentiment: 🟢🟢🟢 — Fully Bullish
* IVR: 62.7 → High implied volatility, tradable swings.
* IVx avg: 81.2
* CALL$%: 32.4% → Bullish call flow dominates.
* Support Walls:
* 255 (PUT Wall 1)
* 250 (Put Support)
* Resistance Walls:
* 282.5 (CALL Wall 2)
* 300 (Gamma Wall)
📌 With strong bullish options flow and GEX positioning, market makers are likely to support pullbacks and encourage reversion higher unless 255 breaks.
🛠️ Trade Scenarios
📈 Bullish Setup – Rebound from 267–268 Zone
* Price respects current HVL zone and shows reversal signs.
* Entry: Break above 270 or reclaim with volume.
* Target 1: 275
* Target 2: 282.5
* Target 3: 288–300 (extended breakout)
* Stop-Loss: Below 265
* Options Play:
* Long Apr 12 $275 Calls
* Aggressive: $280/$290 Call Spread targeting breakout to Gamma Wall
📉 Bearish Setup – Breakdown Below 267
* If 267 fails and price breaks into lower zone.
* Entry: Break below 265 with strong volume
* Target 1: 255
* Target 2: 250
* Stop-Loss: Above 270
* Options Play:
* Long Apr 12 $260 Puts
* Debit Spread: Buy $265 / Sell $255 Puts
🧭 Final Thoughts & Bias
* Bias: Bullish unless 267 fails.
* Key Level: 267.5 (gamma pivot) – price staying above suggests bullish continuation.
* GEX Implication: Dealers are long calls and may hedge by buying dips → supportive near 255–267.
📍 Ideal play today: Watch for early reversal near 267, and scale into calls on confirmation.
📛 Disclaimer: This analysis is for educational purposes only and does not constitute financial advice. Always do your own research and manage your risk.
TSLA the companyReviewing my charts out loud. I like the month and week view best. Watch the zones. Above 250 TSLA is above water. Will take a look at how week and month close to see if anything pops out at me. Tootles!
*I watch for setups
*BYD is gaining market share in China
*Europe may not want to affiliate right now
*Dubai for funding?... I happened to read years ago that Dubai investors put their money behind Lucid (LCID). Their earnings Q1 2025 was stellar.
*Currently, TSLA sales are in a slump
TESLA formed the new bottom and is going for $600.Tesla / TSLA is on the 2nd straight green 1week candle, crossing above the 1week MA50.
With the 1week RSI bouncing on the 2 year Rising Support, the Channel Up has technically formed its new bottom.
Both the current and the previous one were formed on the 0.618 Fibonacci retracement level after a -55% decline.
If the bullish wave is also as similar as the bearish waves have been, the price should reach as high as the -0.382 Fib extension.
Buy and target the top of the Channel Up at $600.
Follow us, like the idea and leave a comment below!!
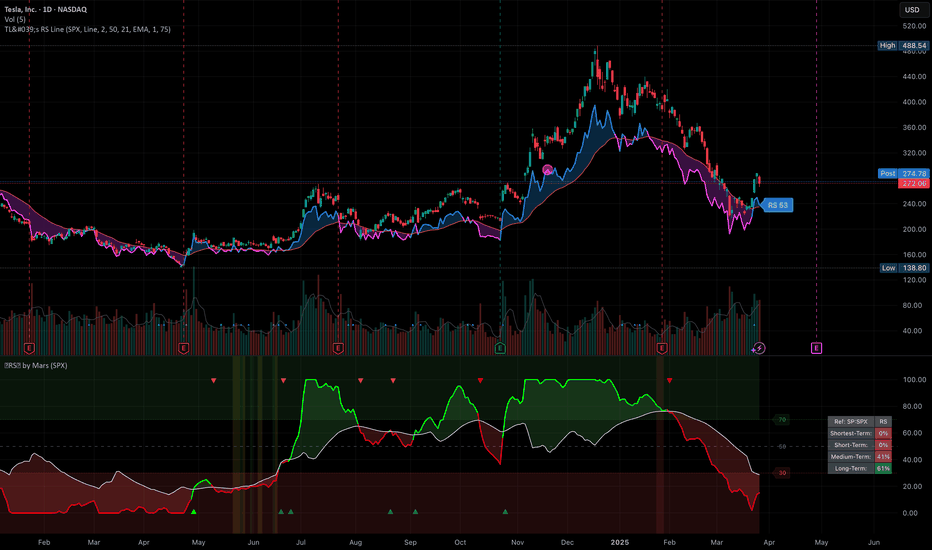
TSLA looking for rejection around 200HMASo, I've been bearish on TSLA around that $400 mark and was waiting for more PA to evolve before calling the shots. It broke down. Quite rapidly actually. Currently looking to see what happens when price floats around that 200HMA in red. Also looking at weekly RSI that broke down the centre of the channel. If RSI on weekly cannot reclaim above centra at 50 and price has a hard time returning above 200HMA, I'll be looking for another leg down on HTF. I'm looking at weekly timeframe here so be mindful about that. I'm fluid. For me, price doesn't have to get a clean rejection for me to make up my mind. Although, that would make life easier, I'll also look at how price behaves around a certain price level. What I mean by that is: I don't care whether the price will go higher than that 200HMA in daily candles. I care about weekly closes and formations around that area.
TSLA Shorts, Done in 15 minPDH taken, CISD, H1 IFVG, MMSM forming with draw on PDL but with RB right above profit target needed to be adjusted. The price kept creating bearish pd arrays showing hand that the draw was lower and entry was after H1 BISI was inverted and entered on retracement with partials along the way. I'll try to label my charts post trade.
Tesla stock has completed 5 downward waves.Tesla stock has completed 5 downward waves
Currently, market sentiment is highly negative. A correction to the $296-$326 area, which corresponds to 38.20 and 50% Fibonacci levels, seems likely. They have also covered the gap from below.
After Tesla stock's correction, I expect a global collapse of the SP500, the US stock market, and the cryptocurrency market.
You can review ideas for Bitcoin, Ethereum, Solana, SPY/SP500:
-----
SP500/SPY:
Today:
-----
Bitcoin:
-----
Ethereum:
-----
Solana:
How far will $TSLA go?How far will NASDAQ:TSLA go?
Elon is rolling into the Golden Age with robotaxi’s, A.I. and humanoid robotics.
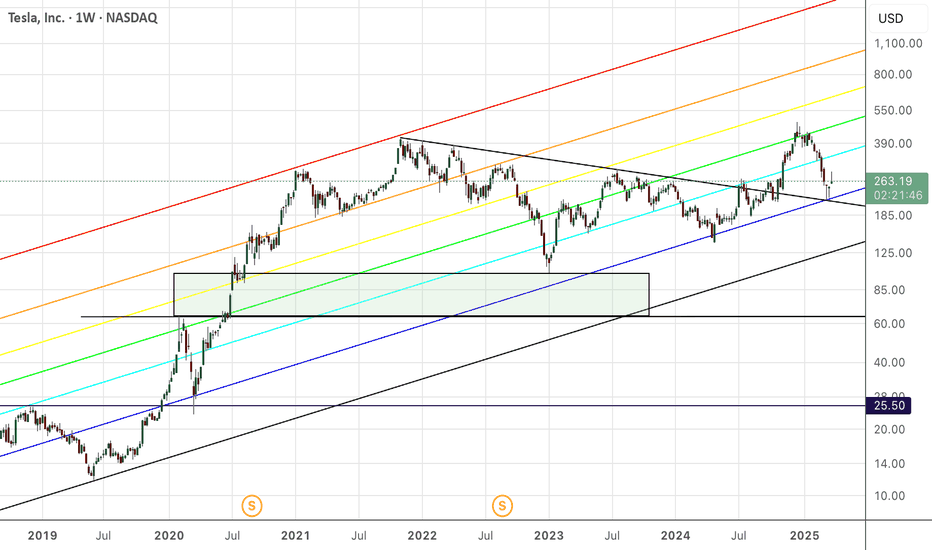
Some baseline technical analysis. Pitchfork projected from the 2019 impulse waves. Price has touched the median line twice and the bottom of Fibonacci fork thrice. Setting up a possible three drives waves pattern.
Break $600 on this run up and we’ll see $1,000-$1,700 quickly to reach the top of the pitchfork completing the impulse waves. This puts Tesla at a marketcap of $5.47T


