TSLA : A lot of whipsawingThis has been a very volatile stock to hold. However for those who are bullish on this name long term, I can see this expand and impulse out into a larger 3rd wave. A smaller retracement still fits in this narrative to complete the wave 2 bottom. Let's see how earnings play out.
TSLA trade ideas

TeslaTSLA
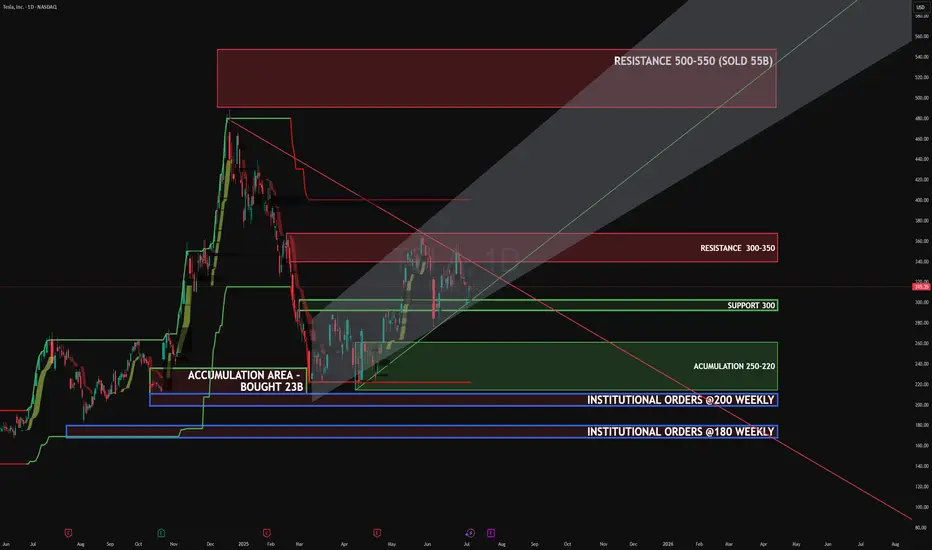
Compression forming inside rising channel
Symmetrical triangle = explosive breakout setup
SUP: 300 / 250–220 (institutions bought $23B)
RES: 350 / 500
Target: 500
#TSLA #Tesla #Breakout #Stocks #Trading #OptionsFlow #PriceAction
TESLA: Bulls Will Push
The price of TESLA will most likely increase soon enough, due to the demand beginning to exceed supply which we can see by looking at the chart of the pair.
Disclosure: I am part of Trade Nation's Influencer program and receive a monthly fee for using their TradingView charts in my analysis.
❤️ Please, support our work with like & comment! ❤️

$TSLA Bullish Pennant Forming on Daily – Breakout Loading?Tesla ( NASDAQ:TSLA ) is currently trading within a bullish pennant formation on the daily timeframe — and this one is textbook.
It entered the pennant from lower prices, forming a clear flagpole. Since then, price has been compressing between:
📉 Two descending resistance levels → Lower highs
📈 Two ascending support levels → Higher lows
This symmetrical tightening creates a classic bullish continuation setup — if the breakout confirms. Also found support at horizontal level of support/resistance $229.
What I’m watching:
⇒ Break above pennant resistance with volume
⇒ Reaction to any macro or Tesla-specific news during this compression (earnings July 23)
TSLA has a habit of explosive moves after consolidation. Keep this one on high alert.
#TSLA #Tesla #technicalanalysis #bullishpennant #tradingview #DisciplineTrading

Retested Wedge Bullish Breakout = New Highs?
NASDAQ:TSLA
NASDAQ:TSLL
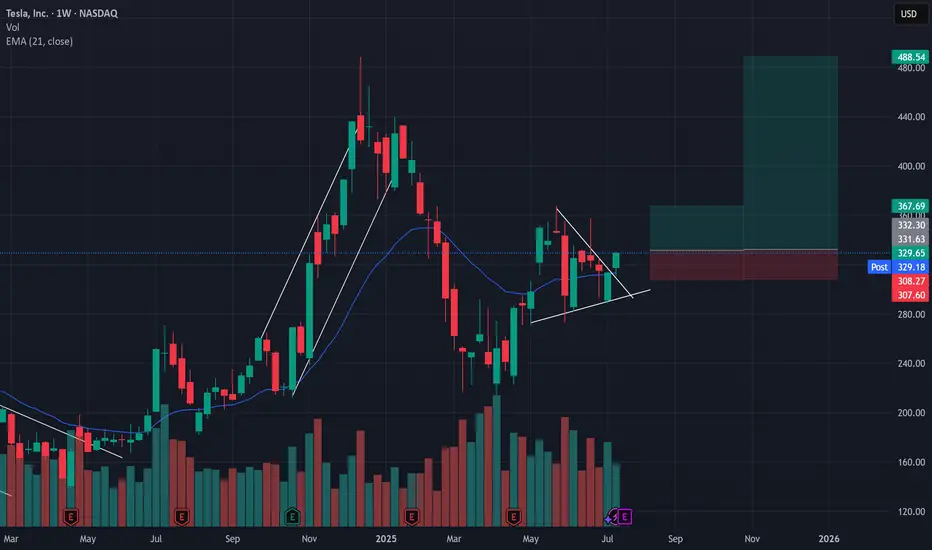
Tesla has currently showcased two very bullish setups with one already taking place.
Over the past 2 month we've seen TSLA swing dramatically from a high of $368 to a low of $278 while producing lower highs and higher lows AKA a wedge formation.
Wedge formations are a low probability set up and typically produce a 50/50 breakout, however there are a couple of bullish signals on the weekly chart that have kept me in my TSLL position expecting a retest of either the $368 high and/or $490.
Bullish insights -
1 - After a strong push above the 21d EMA, TSLA had a 2 legged pull back with last week being a short failure and closing above the 21d EMA
2 - this week's candle retested the breakout trendline and closed in a very bullish candle.
3 - Tesla's $488 high was an overshoot which produced a strong breakout to the low end, however there was no new high formed meaning there is a high probability chance that we will revisit ~$500.
Trade set up Idea:
If next week's candle forms higher than this weeks bullish candle, target is $368, Stop loss is set at $306 for a 1:1.5 Risk vs reward.
Or
If next week's candle forms higher than this weeks bullish candle, target is $348, Stop loss is set at $306 for a 1:6.5 Risk vs reward.
I'm holding for the second one ;)
Current position - 7400 shares of TSLL
$TSLA Fibonacci Expansion Targets in Play – VolanX Precision Le🔋 NASDAQ:TSLA Fibonacci Expansion Targets in Play – VolanX Precision Levels
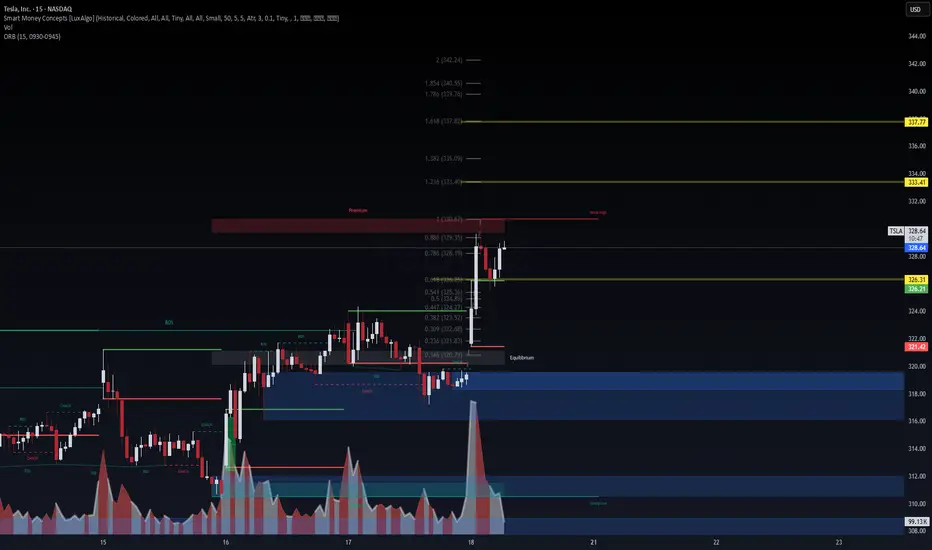
TSLA just powered through a clean bullish reversal from the discount zone and now trades inside the premium supply block near 330.67. This zone aligns with:
📍 0.886 Fib (329.35)
📍 Weak high at prior inefficiency
📍 VolanX ORB resistance (326.21–330.67)
🧠 WaverVanir VolanX Setup:
✅ CHoCH → BOS → Premium Tap
✅ ORB (15) broken to upside with volume (76.6K)
🟡 Currently testing equilibrium/premium confluence
🎯 Fibonacci Expansion Targets:
1.236 → 333.40
1.382 → 335.09
1.618 → 337.77
2.0+ range → 342–347 (if melt-up continues)
⚠️ Trade Logic:
A pullback to 326.30 may serve as a re-entry zone.
Watch for rejection at 330.67 — if it fails, bulls could reclaim control into the 333–337 fib cluster.
Macro + flows suggest continuation, but premium rejection remains possible. Stay nimble.
📌 #TSLA #Tesla #WaverVanir #VolanXProtocol #SmartMoneyConcepts #ORB #Fibonacci #LiquidityZones #BreakoutSetup #TradingView #OptionsFlow #Scalping #MacroMomentum
TSLA: Up for earnings on Wednesdayinitial move is, I think $350.
But can Elon bring in the buyers for earnings?
There's a healthy mix of bearish and bullish sentiment, but at the end of the day, promises hold weight, and do they hold weight?
All the best.

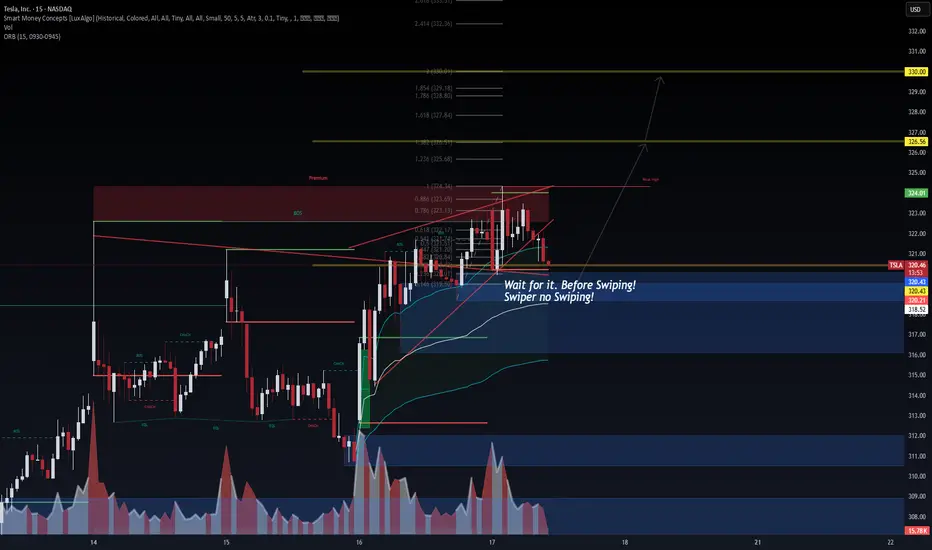
TSLA: Time for the 2/3 rally?TSLA remains tightly wedged inside a bullish pennant, hovering just above the ORB high (324.01) and within the premium SMC zone. Smart Money structure is clear:
🔹 Bullish BOS + CHoCH stacking
🔹 Fibonacci confluence from 0.618 to 0.886 holding strong
🔹 Hidden demand resting at 320.21 / 318.66 zone
🧠 VolanX DSS Logic:
Break above 324.34 unlocks liquidity toward 1.236 = 325.68, then key magnet zone 326.56
Liquidity sweep + micro pullback ideal entry signal
Volume shows absorption at each higher low → bullish intent
🎯 Trade Plan (15m):
Entry: 322.00–324.00 with confirmation
Target: 326.56 → 328.18
Invalidation: Below 320.21 BOS flip
ORB + Fib + SMC stack = High-conviction directional play
💬 Price may seek inefficiencies left in prior imbalance zones below, but current order flow favors upside continuation.
📢 This analysis is powered by the VolanX Protocol under WaverVanir DSS — where liquidity meets logic.
#TSLA #WaverVanir #VolanX #SMC #DayTrading #Fibonacci #ORB #SmartMoneyConcepts #Tesla #MacroEdge #OptionsFlow
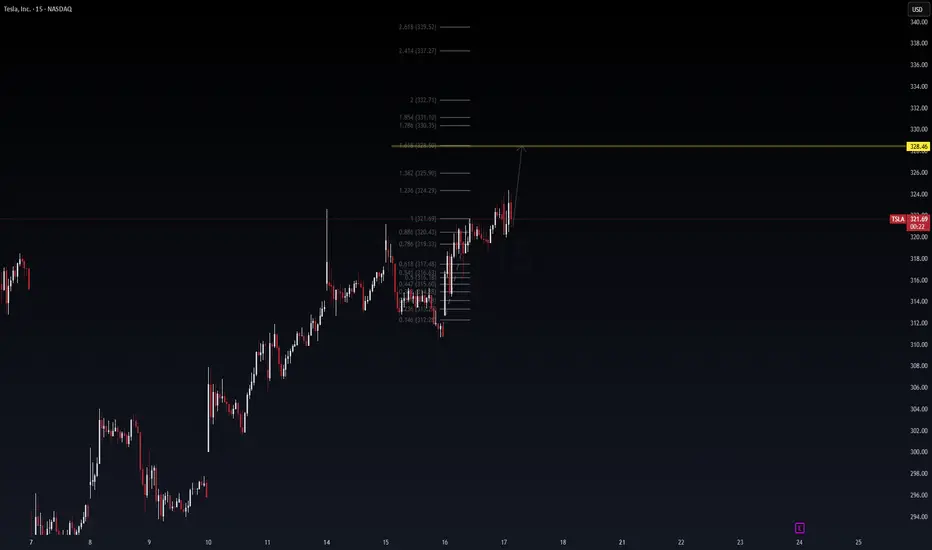
TSLA Fibonacci Launchpad: 328.46 in Sight? (15-min Daytrade Setu🔋 TSLA Fibonacci Launchpad: 328.46 in Sight? (15-min Daytrade Setup)
Posted by WaverVanir_International_LLC | Powered by VolanX Protocol
TSLA continues to show bullish continuation structure on the 15-min timeframe. After a textbook retracement to the golden pocket (0.618–0.786), bulls defended $315-$317 zone and reclaimed $321 resistance.
📌 Technical Thesis
Clean impulsive wave from $312.24 → $321.69
Consolidation → Breakout structure with low selling volume
Fib extension targets 1.618 at $328.46, followed by confluence zones at $331 and $332.71
Price respecting higher lows, forming micro bull flag
📈 Entry Idea:
Intraday breakout confirmation above $324.29 (1.236 extension)
Risk-managed long setup with stops below $320.43 (0.886)
Target zones: $328.46 → $330.35 → $332.71
⚠️ Risk Note:
Heavy resistance expected around $328–$332 zone. Scalp profits near extensions or trail stops tight.
🔮 VolanX Signal Score: 7.5/10
Favoring upside continuation unless macro catalyst shocks sentiment.
#TSLA #DayTrading #Fibonacci #Scalping #VolanX #WaverVanir #TechStocks #OptionsFlow #AITrading #PriceTargets #TeslaTraders
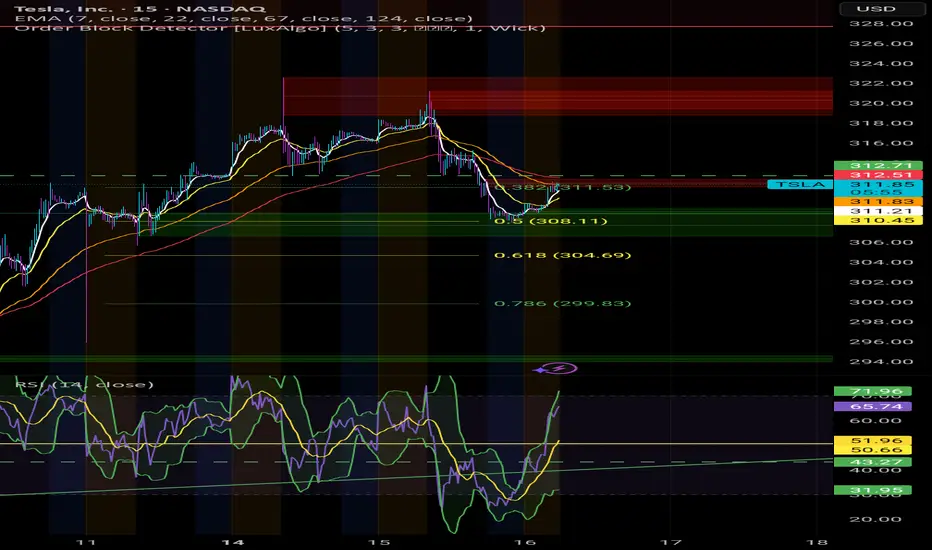
TSLA: DT 7/16/2025Took a trade at the fair value gap 15 min TF, If the market is going to reverse it is either going to be from .50 or .382.

Is the BullRun over? I don't think so. $TSLAYesterday we saw a somewhat heavy fall in Indexes, and it probably scared alot of retail Bulls outs.
However, it seems we've fallen straight into potential medium term supports across multiple stocks in the markets.
I'm convinced we will get a good economic data print today.
This would open the door to new ATHs, again, in the Indexes.
For this to play out, the local bottoms established over night need to hold.
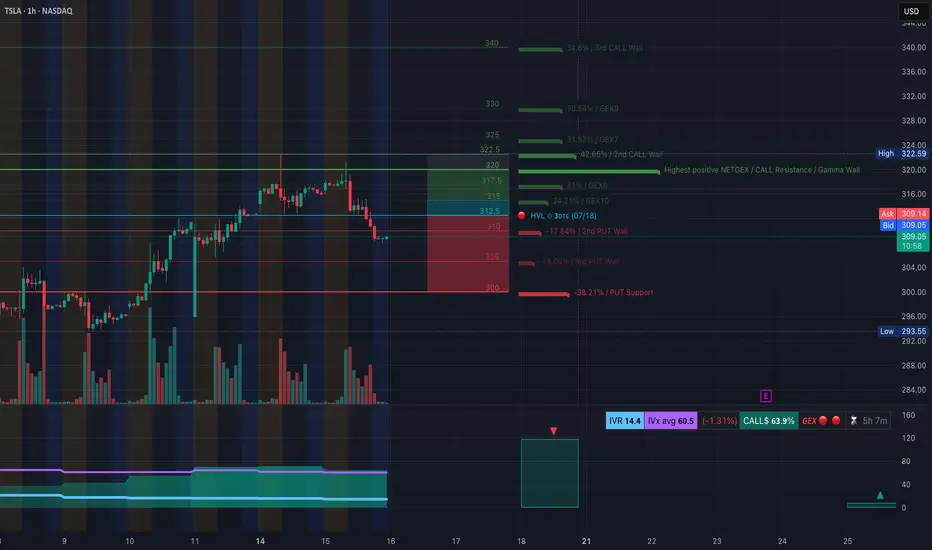
TSLA at a Turning Point. Gamma Flip + Price Breakdown? TAJuly 16🔍 GEX Analysis (Options Sentiment)
* Key Call Walls (Resistance):
* $322.5: +42.65% GEX — Major resistance and 2nd Call Wall
* $325 / $330: More overhead call resistance
* $317.5: Minor resistance
* Gamma Flip Zone (Highest Net GEX / Resistance):
* Around $320–322.5, price is likely to face supply pressure from dealers hedging short calls.
* PUT Walls (Support):
* $305: 2nd PUT Wall (−17.84% GEX)
* $300: PUT Support (−38.21% GEX)
* HVL (High Volume Level):
* $312.5: High-volume strike for this week’s expiration – significant battleground.
* IVR/Flow:
* IVR is 14.4 – low implied volatility.
* Call bias dominates: Calls 63.9% vs Puts.
* GEX sentiment = 🟥 Bearish leaning.
💡 Options Strategy Based on GEX
* Bearish Play:
* Buy 305P or 300P for short-term swing into the gamma void.
* Best risk:reward as dealers are likely to unwind positive gamma, accelerating downside toward PUT walls.
* Neutral-to-Bearish Strategy:
* Bear Call Spread around $317.5–$322.5 (above HVL, inside call wall congestion).
* Expect price rejection below $317.5 if no reclaim happens.
* Avoid CALLs unless price reclaims and holds above $317.5 with strong volume and momentum shift.
📈 1-Hour Chart Technical Analysis
* Structure:
* Bearish CHoCH and confirmed Break of Structure (BOS) below $310.
* Price dropped from the upper OB and failed retest confirms supply zone around $317–$321.
* Trendlines:
* Descending wedge forming with lower highs and current support at $307.97 and $305.
* Watch for bounce-to-fail retests at $312.5 or breakdown continuation.
* Zones to Watch:
* Bearish Order Block (OB): $316–$321 (purple zone) = Sell zone.
* Demand/Support Zone: $293–$296 (green box) – likely bounce zone.
📌 Trade Scenarios
* Bearish Intraday Trade Setup:
* Entry: Below $309 or retest rejection from $312.5
* Target: $305 → $300
* Stop: Above $313 or OB invalidation at $317.5
* Bullish Counterplay (Only if confirmed):
* Entry: Hold above $317.5
* Target: $322.5 → $325
* Stop: Break below $315
🎯 Final Thoughts
TSLA looks weak and in distribution after sweeping local highs. The current GEX map favors bearish continuation, and the 1H BOS confirms breakdown structure. Unless $317.5 is reclaimed, bears have the upper hand.
Disclaimer: This analysis is for educational purposes only and not financial advice. Always do your own research and manage risk before trading.
Stocks SPOT ACCOUNT: TESLA stocks buy trade with take profitStocks SPOT ACCOUNT: MARKETSCOM:TESLA stocks my buy trade with take profit.
Buy Stocks at 297 and Take Profit at 319.
This is my SPOT Accounts for Stocks Portfolio.
Trade shows my Buying and Take Profit Level.
Spot account doesn't need SL because its stocks buying account.

TSLA / Earning seasonNASDAQ:TSLA showing nice price action bounce off the base last week. With earnings season here, watch the $315 level — a breakout could send it toward $320 and $326 next 🚀📈 #TSLA

$Tsla $350 looks promisingNASDAQ:TSLA $350 looks promising in the upcoming weeks.
AMEX:SPY NASDAQ:QQQ NFA
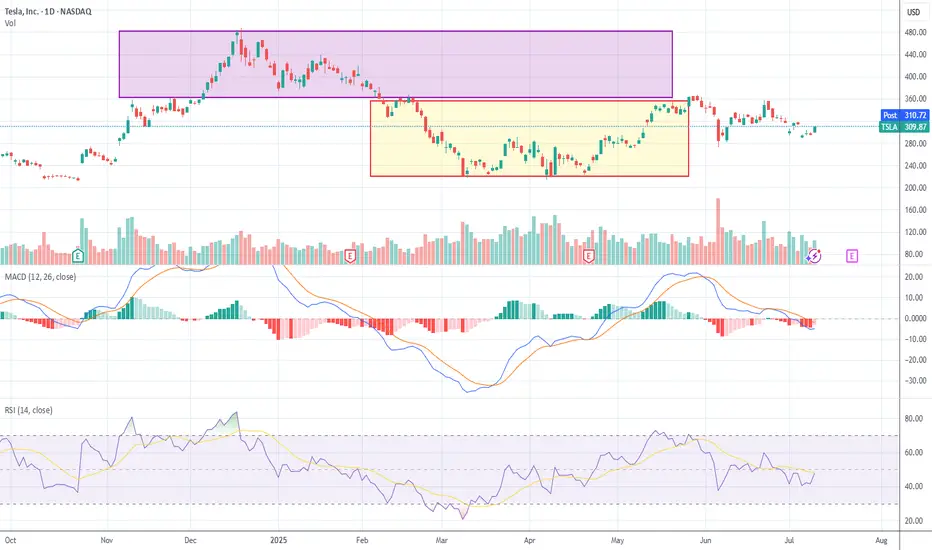
Tesla Flashes Bullish Reversal: Engulfing Candle and Volume PoinLet’s reassess TSLA now that we have this new candle (a big move +4.73%) in context. This changes things substantially, so I’ll reapply candlestick techniques, assess trend health, box positioning, and momentum.
Candlestick Analysis
The new candle:
Large white body (+4.7%) closing at $309.87. Engulfing prior 2 candles’ real bodies → this is a Bullish Engulfing Pattern. Occurs near the 50% retracement ($290) zone (previous support). Volume expanded vs prior days → adds validity. Bullish engulfing after a down leg is an early reversal signal.
Context:
This happens after weeks of indecision candles (spinning tops / dojis) → classic “coiling” behavior before expansion.
Trend Health & Momentum
MACD: Still below zero but histogram bars turning less negative → momentum starting to shift.
RSI: Up to ~47.6, breaking out of its down channel. A move >50 would confirm momentum pivot.
Box Dynamics
TSLA just punched through the upper edge of Box 2 ($300) with conviction.
Now entering “no man’s land” between Box 2 ($300–$360) and Box 1 ($360–$465).
For a sustained breakout it must close above $306–310 range for 2-3 days. Ideally see follow-through with a test of $328 (78.6% Fib).
Tactical Breakdown
✅ Breakout case (higher probability now):
Bullish Engulfing + volume expansion at support zone.
Closing above $306-310 increases odds of a run toward $328 (78.6%) and possibly $360.
❌ Reversal back down (lower probability):
Only if TSLA immediately rejects $310 and falls back below $300 in the next 1–2 sessions.
This price action looks like accumulation showing its hand. Large white candle suggests buyers absorbing supply at prior resistance.
Breakout above $306 confirmed if follow-through continues. Odds for a reversal lower just dropped sharply after today’s engulfing.
Tesla Share Price at Key Technical LevelTesla’s share price has returned to a well-established upward trendline. The key question now is: will this trendline act as support and trigger a bounce, or will it be breached, attracting further selling pressure and pushing the price lower?
We’d love to hear your thoughts — will the bulls defend this level, or are the bears gaining ground?
Tesla's Self-Inflicted Crisis of ConfidenceInvestors wanted Elon Musk to double down on EVs. Instead, they got a new political party and another reason to sell the stock.
Musk vs Trump: A Fight Investors Didn’t Ask For
Tesla’s latest sell-off has little to do with earnings or electric vehicles. Shares dropped 6.8% on Monday after Elon Musk announced plans to launch a new US political party, escalating his feud with Donald Trump and reigniting investor concerns about distraction at the top.
The fallout from Musk’s political re-entry has been swift. Tesla’s valuation has lost over $200 billion since late May, when Musk’s role in Trump’s short-lived government efficiency task force came to an end. His renewed focus on political activism contradicts April’s pledge to spend “far more” time on Tesla, and comes at a moment when the business is already under pressure from slowing EV sales and collapsing regulatory tailwinds.
Politics, Profits and a Shrinking Mandate
Trump’s so-called “big, beautiful bill” is slashing support for electric vehicles across the board. Gone is the $7,500 federal tax credit, set to expire in September. Gone too are the emissions penalties that allowed Tesla to bank billions in regulatory credits from legacy automakers. William Blair analysts estimate that over $2 billion in high-margin profit is now at risk.
The political clash is getting personal. Trump has mocked Musk’s behaviour as a “train wreck”, suggested deportation, and floated nationalising SpaceX. Investors, meanwhile, are left questioning whether Musk’s growing list of battles is starting to erode Tesla’s long-term advantage. The distraction risk is real, and the market is responding.
Technical Breakdown: Key Levels in Play
Tesla’s share price has woefully underperformed this year. The stock is down 22% year-to-date, while the S&P 500 is up 6%. Recent price action highlights just how vulnerable Tesla has become to the political whims of its CEO. The public fallout with Trump helped define a new swing high in May, which now acts as clear resistance. A new swing low was formed in early June, and that is now the short-term level bulls need to defend.
Adding Keltner Channels to the chart puts the recent volatility into perspective. The sideways bands and price bouncing between them show a market stuck in broad equilibrium. There’s little directional conviction, but that may be changing. Monday’s sell-off pushed Tesla below the volume-weighted average price anchored to the April lows. If the shares remain below this VWAP and break under the June swing lows, it would confirm the attempted recovery has failed and signal that the bears are back in control.
For now, Tesla isn’t trading like a high-growth innovator. It’s trading like a politically charged meme stock with no clear trend and no adult supervision.
Tesla (TSLA) Daily Candle Chart
Past performance is not a reliable indicator of future results
Disclaimer: This is for information and learning purposes only. The information provided does not constitute investment advice nor take into account the individual financial circumstances or objectives of any investor. Any information that may be provided relating to past performance is not a reliable indicator of future results or performance. Social media channels are not relevant for UK residents.
Spread bets and CFDs are complex instruments and come with a high risk of losing money rapidly due to leverage. 85.24% of retail investor accounts lose money when trading spread bets and CFDs with this provider. You should consider whether you understand how spread bets and CFDs work and whether you can afford to take the high risk of losing your money.

$TSLA hanging by a threadNASDAQ:TSLA getting rocked again today. Gapped down over 7% at open. Literally hanging by a thread on the bottom of the daily cloud. It's also OUTSIDE of the bottom Bollinger band...
Also otm call flow just came in $1.8 million 325c 7/25 @ 6.40

Could TSLA rebound after a weaker decrease than expected deliverTesla Q2 2025 Delivery fell, but could it rebound in 2H?
Key Figures
Q2 2025 Deliveries: 384,122 vehicles
Year-over-Year Change: Down approximately 13–14% from Q2 2024
Wall Street Expectations: Around 385,000–387,000 vehicles
Production vs. Deliveries: 410,244 vehicles produced, indicating a build-up in inventory
Fundamental analyst
Sales Decline: This marks the second consecutive quarter of declining deliveries for Tesla, reflecting intensifying competition, especially from Chinese EV makers like BYD and legacy automakers such as General Motors, who have gained significant market share.
Aging Product Line: Tesla’s current lineup is considered to be aging, with no major new models launched recently, while competitors continue to introduce fresh, competitively priced vehicles.
Brand and Leadership Impact: Tesla’s brand image and CEO Elon Musk’s public controversies and political activity have contributed to softer demand in some markets.
Inventory Build-Up: Production exceeded deliveries by about 26,000 vehicles, suggesting demand-side challenges rather than supply constraints.
Stock Market Reaction: Despite the delivery decline, Tesla’s stock price rose by about 4–5% after the report, as actual results were better than the most pessimistic forecasts (340,000–360,000 deliveries). The markets are expecting the decreasing trend to be slower.
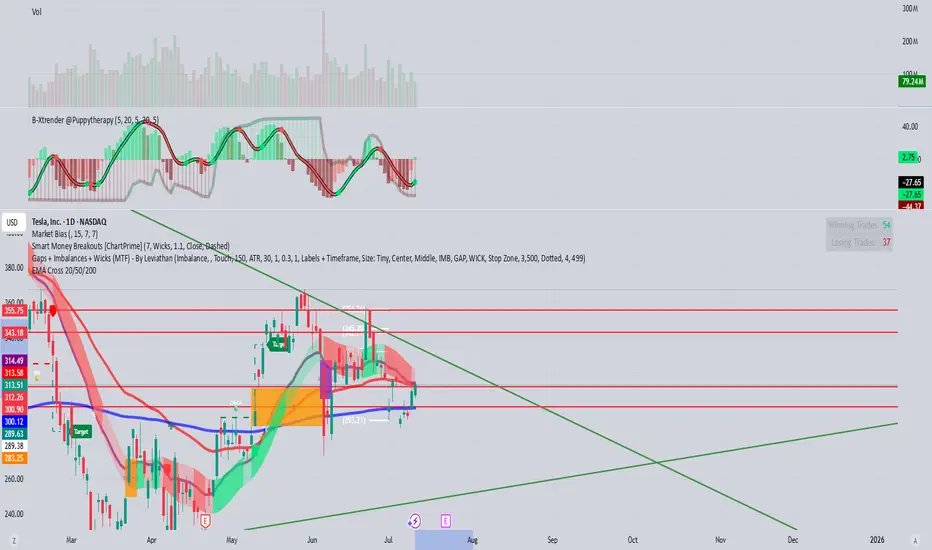
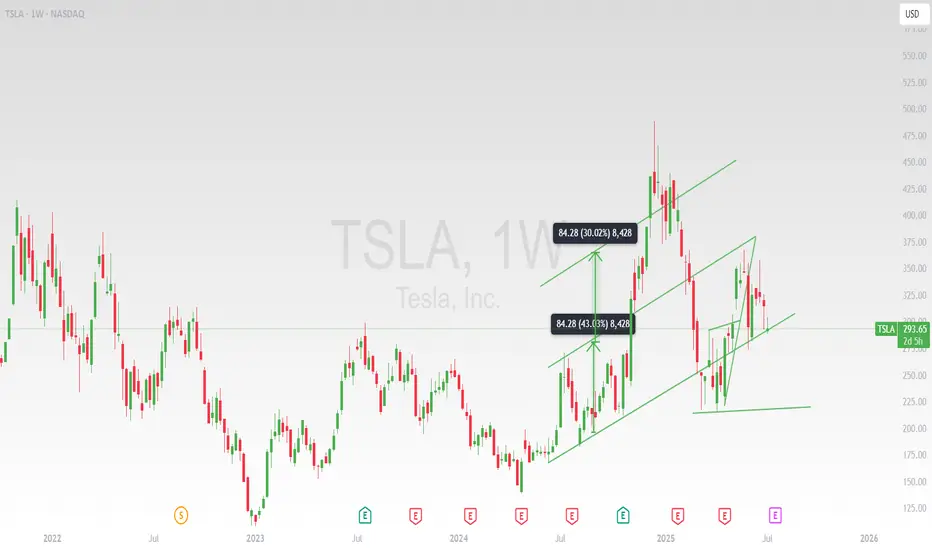
Techincal Analyst
TSLA has rebounded strongly from its 2023 lows, forming a clear upward channel since late 2024. The stock is currently trading near the lower end of this ascending channel, indicating a key support area.
If TSLA sustains above the $300–$310 zone, the uptrend could resume, targeting $350 and potentially $400.
A breakdown below $300 could trigger further declines toward $275 or lower, especially if accompanied by high volume.
TSLA is at a technically important level. Holding above $300–$310 keeps the bullish channel alive, while a break below could signal a deeper correction. For the next directional move, watch for volume spikes and price action near these key levels.
By Van Ha Trinh - Financial Market Analyst from Exness

Big Bounce or Breakdown? Tesla at the edgeTesla is at crossroads right now, where the next move will define its near-term trajectory.
After an extended correction phase, TSLA is reaching a key zone around the $300 level, one that held price well during recent pullbacks.
Although recent tax news caused a decline in the price, belief in Tesla’s longer-term trajectory remains strong among many investors.
At the same time, many investors are carefully monitoring the support near $215 to $230, another important zone. This level has acted as a reliable level during past pullbacks, as it suggests the stock has a solid base, despite short-term ups and downs. For these investors, maintaining their positions through consolidation is a test of patience and belief in Tesla’s longer-term trajectory. If Tesla breaks below the $230 support zone, some investors may view this as an opportunity to take advantage once again.
Given the current setup, it’s best to be cautious and wait for confirmation before looking to get involved.

Diamond Reversal Forming On Tesla ($TSLA)This pattern on TSLA fits the outline for a diamond reversal that is referenced on Investopedia.
It has all the "classical" facets of a diamond reversal which is a high (A), a low (C) a higher-high.
Furthermore, this is happening alongside a very similar pattern on NFLX and some bearish patterns on many other stocks.
Similar forms also occurred on SPX in 2021-2222 and Bitcoin in 2021.
The move up from the 2023 lows has the form of an ABC up... which suggests another 5 wave downmove on-par with or even exceeding the previous downmove is on the way.
The move off the highs was a whole 75% so even presuming a moderate 1:1 ratio, the next wave down could be very aggressive which means that an excellent short could be lining up.
Trade safe and be careful out there.

TSLA: Agentic and real world AIThe "this is a just a car company" crowd, as usual, continues to point at the valuation as a reason to short. Not realizing that the valuation has always been high. It's been apart of Tesla's DNA for many years. Like a trend line, you must consider it in your thesis along with everything else.
We will remain on trend. Money printer is running again. Don't get left behind. Don't be a hater because the stock will move the way it wants regardless of how you feel about it.
I'm not a trader.
