TSM - BullishHas potential to reach even higher with earnings coming out on the 19th. However you must always be prepared for the worse. Im playing this conservative. Good luck.
TSM/N trade ideas

TAIWAN SEMICONDUCTOR has one last Low to give.Taiwan Semiconductor Manufacturing Company (TSM) broke last month above the long-term Channel Up and immediately pull-back. So far it has been almost 1 month of sideways trading supported by the 1D MA50 (blue trend-line), which has been holding since November 02 2023.
The 1D RSI is on a Channel Down, i.e. a Bearish Divergence and every time it formed this within the Channel Up, the stock corrected to at least the 1D MA200 (orange trend-line) by -18.73%. This time the 1D MA200 is considerably higher, so with this Bearish Divergence giving more probabilities to extending the pull-back, we do expect one last Low but not as strong as the previous corrections.
This time a -18.29% decline from the top would make a healthy test of the 1D MA100 (green trend-line), good enough to continue the long-term bullish trend with new buyers in the market. The 1D MA50 break, would be the confirmation. As a result, we are now set a short-term target on TSM at $129.00.
-------------------------------------------------------------------------------
** Please LIKE 👍, FOLLOW ✅, SHARE 🙌 and COMMENT ✍ if you enjoy this idea! Also share your ideas and charts in the comments section below! This is best way to keep it relevant, support us, keep the content here free and allow the idea to reach as many people as possible. **
-------------------------------------------------------------------------------
💸💸💸💸💸💸
👇 👇 👇 👇 👇 👇

Earthquake Rattles Taiwan: Chip Stocks Tumble Amidst UncertaintyIn the wake of Taiwan's most powerful earthquake in a quarter-century, the semiconductor industry finds itself on shaky ground. The seismic event, which caused buildings to crumble and triggered tsunami advisories in neighboring countries, has sent ripples through the global chip market, with leading players such as Taiwan Semiconductor Manufacturing Co. ( BCBA:TSMC ) feeling the tremors of uncertainty.
BCBA:TSMC , the world's largest contract chipmaker and a linchpin in the semiconductor supply chain, was quick to assure the safety of its workers in the aftermath of the quake. However, the evacuation of personnel from some fabs underscores the vulnerability of critical production facilities to natural disasters.
While initial inspections showed no significant damage to TSMC's construction sites, the decision to suspend work for the day speaks to the company's cautious approach in ensuring the safety and integrity of its operations. With further evaluations underway, BCBA:TSMC faces the challenge of mitigating any potential disruptions to its manufacturing processes.
The repercussions of the earthquake were felt beyond Taiwan's borders, with flights disrupted in Japan and tsunami advisories issued in both Japan and the Philippines. The ripple effects extended to the financial markets, with shares of BCBA:TSMC falling 1% and the broader Taiwan Weighted Index dipping by 0.9%.
Amidst the chaos, the resilience of Taiwan's infrastructure was put to the test, as the Taiwan Stock Exchange Corporation confirmed the normal operation of its computers and network systems following the earthquake. However, concerns linger over the long-term impact on the region's economy, particularly given Taiwan's pivotal role in global semiconductor production.
The earthquake, registering a magnitude of 7.4 in Hualien County, serves as a stark reminder of the inherent risks faced by semiconductor manufacturers operating in seismically active regions. Despite stringent safety protocols, the unpredictability of natural disasters poses a persistent challenge to the industry's efforts to maintain uninterrupted supply chains.
As BCBA:TSMC and its counterparts navigate the aftermath of the earthquake, attention turns to the resilience and adaptability of the semiconductor ecosystem. While the immediate impact may be mitigated, the incident underscores the need for robust contingency plans to safeguard against future disruptions and ensure the stability of the global semiconductor market.
In the face of adversity, the industry must draw upon its collective strength and resilience to weather the storm and emerge stronger than before. For BCBA:TSMC and its peers, the earthquake serves as a sobering reminder of the fragility of the semiconductor supply chain and the imperative of preparedness in an ever-changing world.
Technical Outlook
Amidst the recent turmoil that rogued BCBA:TSMC , the stock managed to close Tuesday's trading with a moderate Relative Strength Index (RSI) of 56.52. However, the stock might break the ceiling of the rising trend channel to find new support.

$TSM good opportunity to get profit in this yearNYSE:TSM opens a good chanse to take 40-50% till the end of this year.
Does not constitute a recommendation.
#furoreggs #investing #stocks #shares #idea #forecast #trading #analysis

TSM BIG move is incoming after 118 retrace ?? TSM
Buy zone - 118
target - 136
invalid zone - 114
Good luck

Buying TSM - 5th wave pivot identifiedPlaced an order for market open to buy TSM. Nice setup here with multiple confirmations.
Elliot Wave 5 identified with a bounce from support zone and Demark buy 9 signal.
TP is open with trade as no resistance level so will target the 1.618 level.

TSM Trade Analysis: Strategy Inspired by Mark MinerviniThis trade embodies the essence of Mark Minervini's championship trading style, focusing on bullish breakout trades. Here's the breakdown:
This is a bullish breakout with increased volume, bearing in mind that volume often precedes price movements. Additionally, the stochastic indicator suggests that the stock is either overvalued or in high demand, reinforcing the bullish sentiment. Moreover, the weekly trend is bullish, adding further confirmation to our analysis.
The daily value zone is identified between 112 and 122, serving as a crucial support zone for the trade. Our target is to surpass the 159 mark, accompanied by a surge in demand.
In summary, this trade aligns with Mark Minervini's approach and presents a compelling opportunity for bullish momentum.
Feel free to share your thoughts and comments below. Let's discuss this potential breakout opportunity together!

TSMC Trend Cloud StudyTSMC as you all know is the Taiwan Semiconductor Manufacturing Company.
Mr. Warren Buffet bought a huge chunk of shares of late last year, but recently sold on fears?
But did make a huge % gain for his investors.
So Investing is Risky, and I am more of a longer term type investor.
But as all investing, we need to document our decisions and I can show all how to use the simple built in tools as CALL OUTS and the PRICE RANGE tools to follow one's decisions where this Chart can show.
Time and Money Invested is also Important, and here it is very risky and needs a Crystal Ball.
If you have one, I'll buy it.
Jokes aside, the AI Semis are on a roll. See ARM + SMCI etc.
Also the BitCoin hypes are moving the Miners again.
Smash That Rocket Boost Button to show your appreciation for my Studies.
Regards Graham.

TSMC To Win More Than $5 Billion in Grants for a US Chip PlantTaiwan Semiconductor Manufacturing Co ( BCBA:TSMC ), the world's largest contract chipmaker, is set to win more than $5 billion in federal grants from the U.S. government for setting up a chipmaking plant in Arizona, Bloomberg News reported on Friday.
The award is yet to be ascertained and it is unclear whether BCBA:TSMC will tap the loans and guarantees also on offer from the 2022 Chips and Science Act, the report said, citing people familiar with the matter.
TSMC, makes chips used in Apple's iPhones, has said it would invest about $40 billion in its Arizona plant, among the largest foreign investments in U.S. history.
The U.S. has been vying to increase domestic semiconductor production through the U.S. CHIPS Act, which was passed in 2022 and provides $52.7 billion in funding, including $39 billion in subsidies for semiconductor production and $11 billion for R&D.
Last month the Biden Administration said it was awarding $1.5 billion to contract chip manufacturer GlobalFoundries under the Act. U.S. Commerce Secretary Gina Raimondo had said in February, the department plans to make several funding awards within two months.
TSMC's advanced manufacturing processes are used in the production of Nvidia's industry leading artificial intelligence chips.
The Taiwanese chipmaker had said in January that demand for advanced packaging was very strong and it couldn't offer enough capacity to support customers, which will continue to next year. Lagging capacity for advanced packaging has been a central bottleneck for the scaling up supply of complex AI chips.
Technical Outlook
Amidst facing a decline in share price by about 1% on Friday's trading session, NYSE:TSM Relative Strength Index of 74.45 poses positive signs of trend reversal coupled with the Grant being awarded to $TSM.

Stocks I have missed and others to enter right nowI regret investing in MSTR and TSM. But we can focus on now and foregt the past as we have good entries in PYPL, SQ and NIO.
Also a quick update on TQQQ that is going according to plan.

TSM: More room for semiconductors to winThis post should speak for itself. A lot of positive sentiment towards the stock and I'm hoping for it to shoot up in the next month. First target 140-150, second target 160.

TSMC Surges to Record High on AI OptimismTaiwan Semiconductor Manufacturing Co. ( NYSE:TSM ) has reached unprecedented heights, surging to its highest-ever level amidst a global rally in chip stocks driven by the promise of artificial intelligence (AI). As TSMC's market capitalization approaches $600 billion and its stock price reaches historic milestones, the company emerges as a pivotal player in the technological renaissance reshaping industries worldwide.
Record-Breaking Performance:
TSMC's stock soared by 5.2% to close at NT$725 in Taipei, marking a historic milestone since its listing in 1994. This surge propelled its market capitalization to $597 billion, edging closer to reclaiming a coveted spot among the world's 10 most valuable companies. Against the backdrop of a global chip shortage and burgeoning demand for AI-powered technologies, TSMC's meteoric rise underscores its pivotal role in driving technological innovation and economic growth.
Key Beneficiary of AI Boom:
As the main supplier to tech titans like Apple Inc. and Nvidia Corp., TSMC stands at the forefront of the AI revolution, poised to capitalize on the burgeoning demand for advanced semiconductor solutions. With executives anticipating a return to solid growth fueled by the AI boom, TSMC's strategic positioning and technological prowess position it as a key beneficiary of the ongoing technological paradigm shift. Nvidia's recent upbeat results serve as a testament to the robustness of the semiconductor sector and further fuel investor optimism surrounding TSMC's prospects.
Driving Technological Innovation:
TSMC's relentless pursuit of technological innovation and commitment to advancing semiconductor manufacturing capabilities underpin its leadership in the industry. As AI continues to permeate diverse sectors, from autonomous vehicles to healthcare and beyond, TSMC's cutting-edge chip solutions play a pivotal role in enabling transformative AI applications. By leveraging its expertise and infrastructure, TSMC empowers companies worldwide to push the boundaries of AI innovation and unlock new possibilities for the future.
Implications for the Semiconductor Industry:
TSMC's record-breaking performance and pivotal role in the AI ecosystem signal a paradigm shift in the semiconductor industry. As AI emerges as a driving force behind technological innovation and economic growth, semiconductor manufacturers like TSMC play a central role in fueling this transformative journey. With increasing reliance on AI-powered technologies across industries, TSMC's continued success underscores the critical importance of semiconductor innovation in shaping the future of humanity.
Conclusion:
TSMC's unprecedented ascent to historic highs epitomizes the transformative potential of the semiconductor industry in driving technological innovation and economic prosperity. As the world embraces the promise of AI-powered technologies, TSMC stands at the forefront of this revolution, shaping the future of industries and societies worldwide.

TSM Rally Mode: Your Chance to Buy and Prosper!"## TSM Stock: Short Fundamentals, Recent News, and Disclaimer
**Fundamentals:**
* **Company:** Taiwan Semiconductor Manufacturing Company (TSMC)
* **Industry:** Semiconductors
* **Market Cap:** ~$680 billion (as of Feb 27, 2024)
* **Key Products:** Contract chip manufacturing for various industries like electronics and automotive.
* **Strengths:**
* Leading market share in contract chip manufacturing.
* Strong research and development capabilities.
* Diversified customer base.
* **Weaknesses:**
* Reliant on the global semiconductor demand and supply chain.
* Geopolitical risks due to its location.
**Recent News:**
* **Feb 26, 2024:** TSMC raises 2024 capital expenditure budget, citing strong demand from AI sector.
* **Feb 23, 2024:** Analyst report recommends buying TSM, citing undervalued stock price.
* **Feb 15, 2024:** TSMC announces partnership with Samsung to develop advanced chipmaking technologies.
**Disclaimer:**
* This information is for educational purposes only and should not be considered financial advice.
* Investing in stocks involves significant risks, including the potential for loss of capital.
* Always do your own research before making any investment decisions.
**Additional Notes:**
* TSM stock price has been volatile recently, reflecting broader market trends.
* The recent news highlights TSMC's strong position in the semiconductor industry and its focus on innovation.
* As with any investment, it's crucial to understand the risks involved before investing in TSM or any other stock.

TSMC remains on trackThe long-term outlook for all semiconductor companies is positive
Due to the boom in artificial intelligence and the increased demand for chips
The only obstacle they may face in the coming period will be any fear regarding supply chain disruptions
TSM itself has positive news and positive expectations for the coming period, especially after its announcement of the N3 FINFLEX™ technology and the N2 Nanosheet technology.
And also its expansion plans to start production in its first factory in Arizona in the first half of 2025, with the continuation of construction work in the second factory, the opening of which may be postponed to 2027.
And its announcement of building a new factory in Japan
Semiconductor companies are generally linked indirectly
Waiting for NVDA's earnings report today may delay the short-term outlook
technically
Overbought – Harmonic BAT pattern, after 100% Fibo extension of the uptrend from the bottom
Possibilities for a correction to the observation area - short to medium range

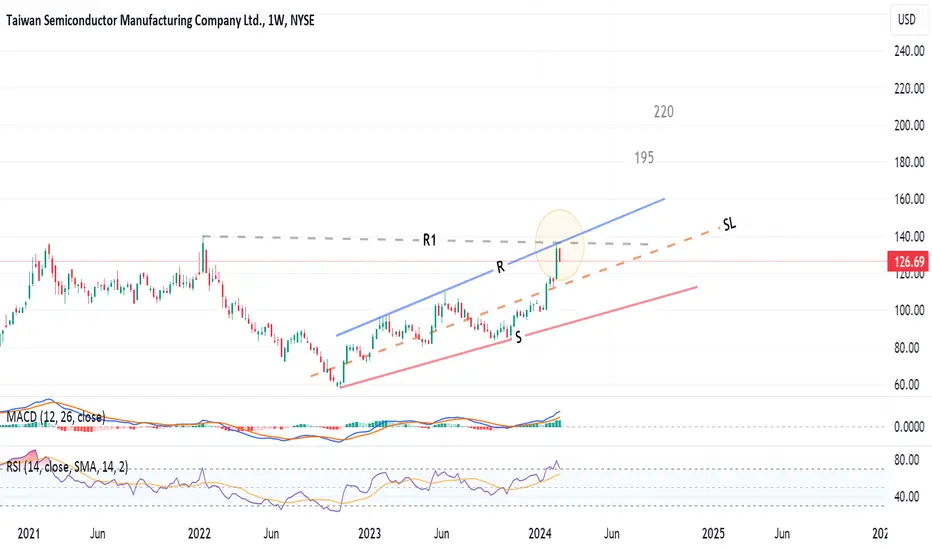
TSM could not make the breakout!Weekly chart, the stock reached a cluster of resistances R1 and R, and could not cross.
There is a tendency to test the mid line or the support line S
Above the R line, a rising expanding wedge pattern will be completed, and the target will be 195 then 220
Stop loss below SL line
TSM heads up at $133.7x double fib confluence, time for pullbac?TSM just popped into a double fib confluence..
Chip sector is very strong, so likely to continue.
Looking for a little dip to add, or Break-n-Retest
$ 133.65 - 133.79 is the exact zone up here.
$ 177.02 - 119.18 will be first strong support.
$ 142.82 - 143.91 will be next resistance above.

TSM ready for 120TSM break out to 120, 125
After a few days of consolidation from its 105 break out to 110,115. We should see 120 and 125 in a few days or by Feb monthly.

TSMC's Ambitious Expansion Plans in JapanIn response to soaring customer demand and amidst ongoing global chip shortages, Taiwan Semiconductor Manufacturing Company ( BCBA:TSMC ), the world's largest chipmaker, has announced its intentions to bolster its presence in Japan by constructing a second semiconductor fabrication plant, or fab. This ambitious endeavor comes as part of TSMC's broader strategy to expand its manufacturing capabilities globally, further solidifying its position as a key player in the semiconductor industry.
TSMC to Construct Second Semiconductor Plant in Japan:
The decision to establish a second facility in Japan underscores BCBA:TSMC 's commitment to meeting the growing needs of its clientele while diversifying its production footprint. Japan Advanced Semiconductor Manufacturing (JASM), a subsidiary majority-owned by BCBA:TSMC , is slated to spearhead this initiative, with construction set to commence by the end of 2024 and operations expected to commence by the end of 2027.
The Impact on Global Semiconductor Market Dynamics and TSMC's Growth Trajectory:
The significance of this investment extends beyond TSMC's corporate strategy, as it symbolizes a collaborative effort between private enterprises and governmental support. With an investment exceeding $20 billion, bolstered by contributions from Toyota Motor and Sony, TSMC's expansion in Japan is poised to generate approximately 3,400 skilled job opportunities, signaling positive economic prospects for the region.
This development also comes amidst TSMC's previous announcement of plans to establish a semiconductor plant in Arizona, USA, aimed at bolstering domestic manufacturing capabilities. While delays in the Arizona project have surfaced, TSMC's steadfast commitment to expanding its global presence remains unwavering.
Technical Outlook:
From a technical perspective, BCBA:TSMC 's stock performance reflects an upward trajectory, albeit with short-term fluctuations. The recent break in the rising trend indicates a potential for corrections in the short term. However, with no significant resistance apparent in the price chart and positive momentum reinforced by favorable volume balance, further growth is anticipated.
Conclusion:
As BCBA:TSMC continues to navigate the intricate dynamics of the semiconductor market, its strategic expansion into Japan underscores a proactive approach to address the industry's evolving demands. With its unparalleled expertise in producing advanced semiconductors critical to a myriad of technological applications, TSMC's foray into Japan is poised to reshape the global semiconductor landscape, propelling both the company and its partners towards sustained growth and innovation.

$TSMNYSE:TSM have broken out of weekly consolidation and is extremely bullish with the start of 2nm chip in progress from 2025 onwards.
My view is run up till March 2024 reporting. Not in the 200+ but at least 50% upside.

Semi Conductor manufacturing & BTC Clear correlation with semi conductor manufacturing and BTC, I'm guessing semi conductor industry increases into the future with AI increasing? Hold correlation and we going up I'm guessing along with the money supply increasing also. Have a great day ya all.

TSMC's Strategic Moves and Strong Earnings Fuel Bullish OutlookTaiwan Semiconductor (NYSE: NYSE:TSM ) has recently reported impressive fourth-quarter earnings, surpassing analyst expectations with an EPS of $1.44, beating estimates by $0.06. Additionally, the company's revenue for the quarter came in at $19.62 billion, slightly edging past the consensus estimate of $19.61 billion. This stellar performance, combined with the announcement of a new chipmaking plant in Japan, positions BCBA:TSMC as a compelling investment opportunity. We will delve into the key factors contributing to TSMC's positive outlook, including its financial success, global expansion strategy, and the significance of its upcoming facility in Japan.
I. Financial Performance:
TSMC's robust financial performance in the past quarter reflects its resilience and adaptability in a challenging global landscape. With positive earnings surprises and consistent revenue growth, the company has demonstrated its ability to navigate through geopolitical tensions and industry challenges. Investors are likely to be drawn to TSMC's strong fundamentals, making it an appealing choice in the ever-evolving semiconductor market.
II. Global Expansion Strategy:
The announcement of TSMC's new chipmaking foundry in Japan's Kyushu island signifies a strategic move to diversify its manufacturing footprint. Chairman Mark Liu emphasized the importance of meeting customer needs and securing government subsidies to support global expansion. This forward-thinking strategy not only bolsters TSMC's presence in the Japanese market but also positions the company to tap into government initiatives aimed at boosting domestic semiconductor production. As TSMC continues to evaluate the potential for a second plant in Kumamoto, Japan, it showcases the company's commitment to collaborating with governments and adapting to the evolving dynamics of the semiconductor industry.
III. Rising Stock Trends:
From a technical perspective, TSMC's stock is currently in a rising trend channel, indicating positive development and increasing buy interest among investors. The continued positive signal from the inverse head and shoulders formation hints at a sustained upward trajectory.
IV. Geopolitical Considerations:
TSMC's ability to navigate geopolitical challenges, particularly those between the United States and China, showcases its resilience and adaptability. The company's expansion into Japan aligns with a broader trend of decentralizing semiconductor production to mitigate risks associated with global geopolitical tensions. By strategically diversifying its manufacturing locations, TSMC aims to build trust among customers, fuel future growth, and attract global talent.
Conclusion:
Taiwan Semiconductor's recent financial success, global expansion strategy, and positive stock trends position it as a compelling investment option. The company's ability to navigate geopolitical challenges, coupled with its commitment to meeting customer needs and exploring government partnerships, underscores its long-term vision for sustained growth. As BCBA:TSMC continues to innovate and adapt to industry dynamics, investors may find it to be an attractive addition to their portfolios in the dynamic world of semiconductor manufacturing.

TSM, Uptrend based on AlgoSignal StrategyThe current point exhibits promising upward signals according to my algorithmic system, meeting various criteria. These include rising trading volume, an upward trend indicated by prices above EMA20 and EMA50, and the closing price surpassing VWAP. As a result, the present conditions suggest a potential upward trend.

TSM - Minor Low BuyTSM is in a strong bullish trend and formed a bullflag pullback after reaching L1-L2 target. Prices appeared to try a breakdown through channel support and were quickly bought.
Volume resistance lurks overhead through 99.20, but a breakout would lead to room to run.
I'm looking at this trade from 2 sides.
1. Conservative - wait for another minor low with a less volatile candle at the bottom of the flag or L1+L2 support. Buy on the minor low
2. Aggressive - Buy on any minor low in the channel/breakout of channel.
We will see what develops.
