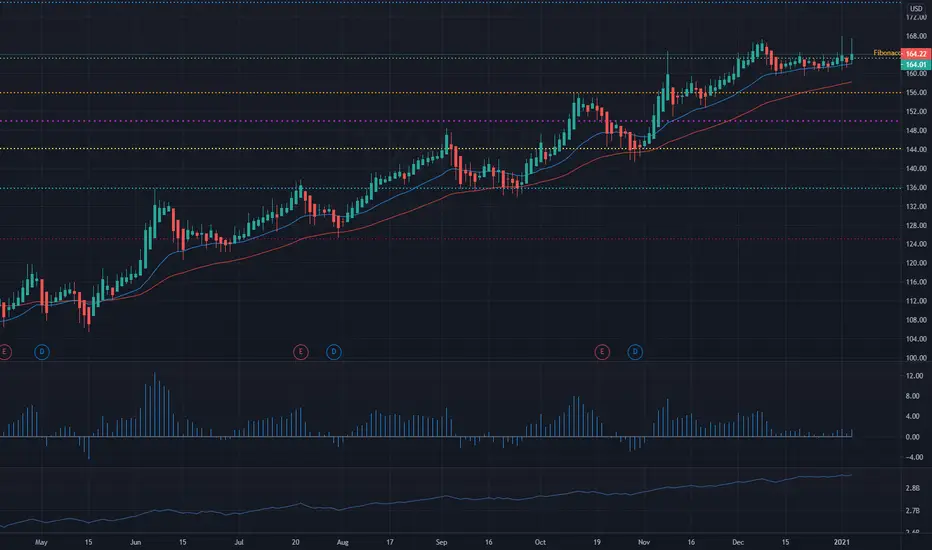
EMAs SupportTXN is holding up nicely on those EMAS.
If the price holds the longer EMA 350 would be possible entry for me
TXN trade ideas

TXN Long William Alligator : the stock is in a bullish position because the candle sticks are above the Teeth, Lips and Jaw. The lines are “eating with an open mouth” and this show that the stock is in a strong uptrend.
MACD : the line is above the signal line, this is a bullish confirmation. Moreover, the green vertical bars indicate that the price is increasing.
ADX : the line is at 42.52, so the stock is in a strong uptrend.
Candlestick pattern s: there is a bullish engulfing which is a bullish confirmation.
Overall : it can be interesting to take a buy position on this crypto because all the indicators indicate that the price is increasing and will continue like that. Moreover, the stock is in a strong uptrend. Entry price is higher than the current price for assurance and stop loss is set at -5%.

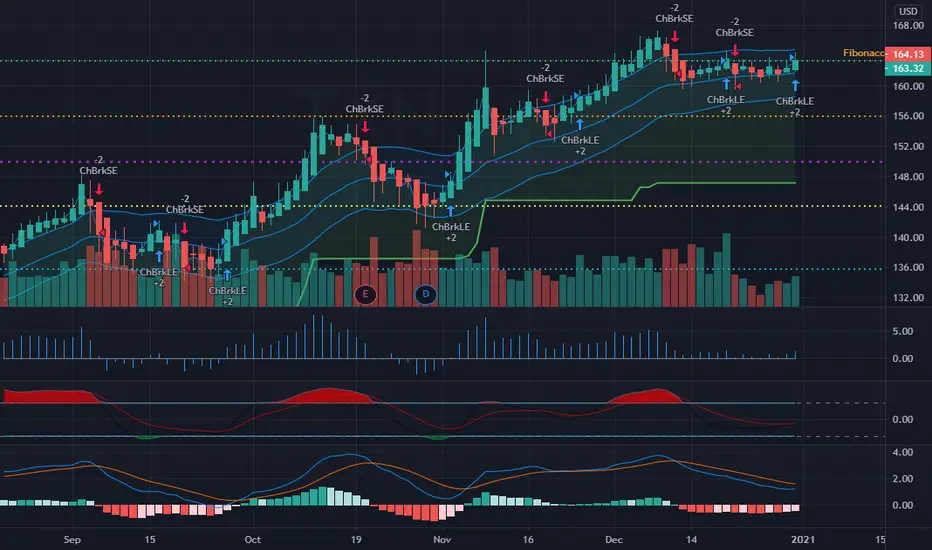
TXN 6 test BreakdownTXN has been in a strong uptrend for the past year. It's 50 sma has been acting as a support zone. It has tested the 50sma now 7 times. With each test lower demand gets taken out. With the market showing strong signs of weakness, i believe that this will crack the upward trend and breakdown to 162 for the near term, and may keep moving lower beyond that.

TXN - Trend FollowingOn the daily chart the ticker bounced off its EMA 50 confirming it as strong support for this well consolidated uptrend

$TXN with a neutral outlook following earnings releaseThe PEAD projected a neutral outlook for $TXN after a negative under reaction following its earnings release placing the stock in drift D
If you would like to see the Drift for another stock please message us. Also click on the Like Button if this was useful and follow us or join us.

Viva la semiconductor*Just an idea, not financial advice*
The chart speaks for itself, this is a friendly trade as dividends are paid.
S1 = Support
R1 = Resitance
Yellow box = Buy zone
White line = Trend line

Possible path for TXNIts been in an uptrend channel for sometime. Will not play this week but will wait to see what happens after earnings.

TXNTXN, and AMD report earnings after close on Tuesday. LRCX reports after close on Wednesday. There is a 9 point move priced in for TXN. If these can report a positive earnings they can help push semi stocks higher. You can play NVDA KLAC, or AMAT, as a sympathy move to avoid paying a high premium.
Lotto Trade Idea: AMAT 108C BID/ASK 1.36/1.45
If you're bearish, AMAT 104P BID/ASK 1.15/1.22 can work.

Texas Instrument: Time to watch & buy: USA By Sun Storm Investment Research
A Profit & Solutions Strategy
Disclaimer: I am not a financial advisor, so please do your own research before trading anything

Long | TXNNASDAQ:TXN
Possible Scenario: LONG
Evidence: Price Action
This is my idea and could be wrong 100%.

Long | TXNNASDAQ:TXN
Possible Scenario: LONG
Evidence: Price Action
This is my idea and could be wrong 100%.
Texas InstrumentsMACD crossover and RSI bullish. Uptrend channel with breakout from support plus above 180 EMA.

TXN consolidating for another run?looks like TXN is following the same trend of run, dip, consolidate, and find new resistance. if this trend continues it should be due for another run to find a new resistance. with a tight stop loss, the risk to reward looks good on this one.


TXN SnapbackTXN has ran up significantly, becoming overextended on the bollinger bands, and overbought and greater than 90 on stochastics. It has also had 5 solid green days leading into the overextension, which are all signs for a pullback. Looking for 155 range as target.


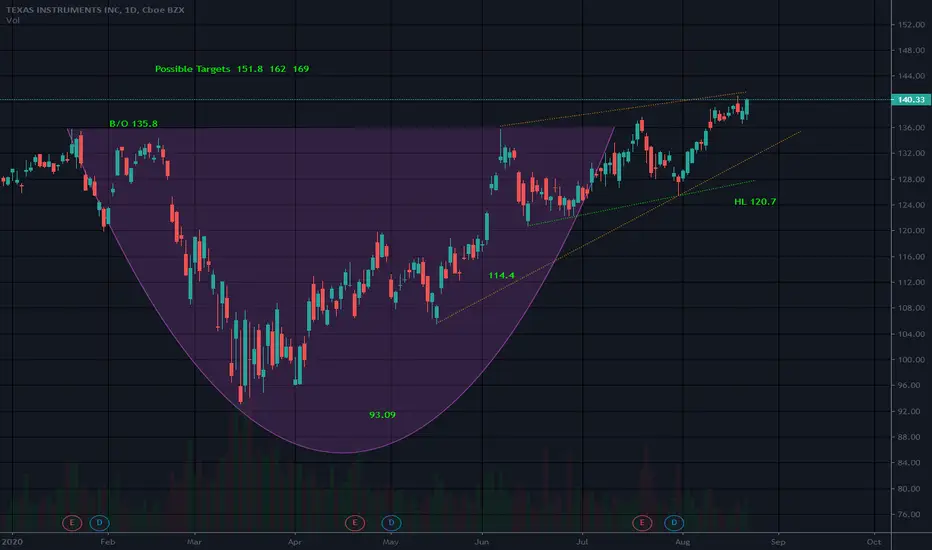
Cup and HandlePossible Rising wedge. Just beware as Rising wedges can have a bearish bias
Handle low came dangerously close to mid cup which would invalidate the pattern.
The Rising Wedge is a bearish pattern that begins wide at the bottom and contracts as prices move higher and the trading range narrows. In contrast to symmetrical triangles, which have no definitive slope and no bullish or bearish bias, rising wedges definitely slope up and have a bearish bias.
While though this article will focus on the rising wedge as a reversal pattern, the pattern can also fit into the continuation category. As a continuation pattern, the rising wedge will still slope up, but the slope will be against the prevailing downtrend. As a reversal pattern, the rising wedge will slope up and with the prevailing trend. Regardless of the type (reversal or continuation), rising wedges are bearish.
Not a recommendation

TEXAS INSTRUMENTS INC: Two in OneThere are great opportunities that must be seized. According to the tendency of the stock market, we suggest a simple process that is divided into four principals actions. The appropriate time when each postion should be taken is indicated in the given chart.
Traders who are concerned, write in comments.
