USFD – US Foods has reached its zenithIn 2020, we had the action, and since 2024 the market's reaction. Just as Newton describes the universal law of Action/Reaction.
However, we see that USFD has reached the centerline of the white Fork, which coincides with the reaction high and the upper median line (U-MLH) of the yellow fork!
There is not much more to say about it.
It's a clear Short to me, and the target are always the Forks and the A/R lines. And if you have enough fantasy, GAP's are always get filled....
...they say.
USFD trade ideas

US FOODS Stock Chart Fibonacci Analysis 09172Trading Idea
1) Find a FIBO slingshot
2) Check FIBO 61.80% level
3) Entry Point > 39.3/61.80%
Chart time frame : C
A) 15 min(1W-3M)
B) 1 hr(3M-6M)
C) 4 hr(6M-1year)
D) 1 day(1-3years)
Stock progress : A
A) Keep rising over 61.80% resistance
B) 61.80% resistance
C) Hit the bottom
D) Hit the top
Stocks rise as they rise from support and fall from resistance. Our goal is to find a low support point and enter. It can be referred to as buying at the pullback point. The pullback point can be found with a Fibonacci extension of 61.80%. This is a step to find entry level. 1) Find a triangle (Fibonacci Speed Fan Line) that connects the high (resistance) and low (support) points of the stock in progress, where it is continuously expressed as a Slingshot, 2) and create a Fibonacci extension level for the first rising wave from the start point of slingshot pattern.
When the current price goes over 61.80% level , that can be a good entry point, especially if the SMA 100 and 200 curves are gathered together at 61.80%, it is a very good entry point.
As a great help, tradingview provide these Fibonacci speed fan lines and extension levels with ease. So if you use the Fibonacci fan line, the extension level, and the SMA 100/200 curve well, you can find an entry point for the stock market. At least you have to enter at this low point to avoid trading failure, and if you are skilled at entering this low point, with fibonacci6180 technique, your reading skill to chart will be greatly improved.
If you want to do day trading, please set the time frame to 5 minutes or 15 minutes, and you will see many of the low point of rising stocks.
If want to prefer long term range trading, you can set the time frame to 1 hr or 1 day.

US FOODS Stock Chart Fibonacci Analysis 032723 Trading Idea
1) Find a FIBO slingshot
2) Check FIBO 61.80% level
3) Entry Point > 35/61.80%

Long | USFD | Swing TradeNYSE:USFD
Possible Scenario: LONG
Evidence: Price Action, Reversal Candlestick, Unusual option activities for July at 40$
TP1: 34.5$, TP2: 37$ TP3:40.5
Stop loss: EMA 100 ~ 30$
This is my idea and could be wrong 100%.

Long scalp $USFDBased on it's uptrend, rebound from support and a familiar chart pattern confirmed by my technical indicators, I expect at least half a percent of profits IF $USFD exceeds today's high of $38.78 during tomorrow's session.

USFD Broke 52Wk fib plus Bull FlagUSFD broke what looked like a double top pattern to form a bull flag and breakout. Also tested 52week fib as support at 37.49.


Been bullish but after today time for a sell offHow much of a sell off before it continues upward? I’m thinking like $25 or $24.5


US Foods - Can fall down to 17 in next few days.US Foods just crossed its immediate short term resistance however i think this may not be a break out given it is rallying with the market. in a very short term i.e. in next few days it may come back to below 19 level. I would interested to buy if it tests $17 level again.

$USFD - possible breakoutNice breakout of the descending wedge yesterday. Looking for continuation into 20.30 and potentially a move into 21.60
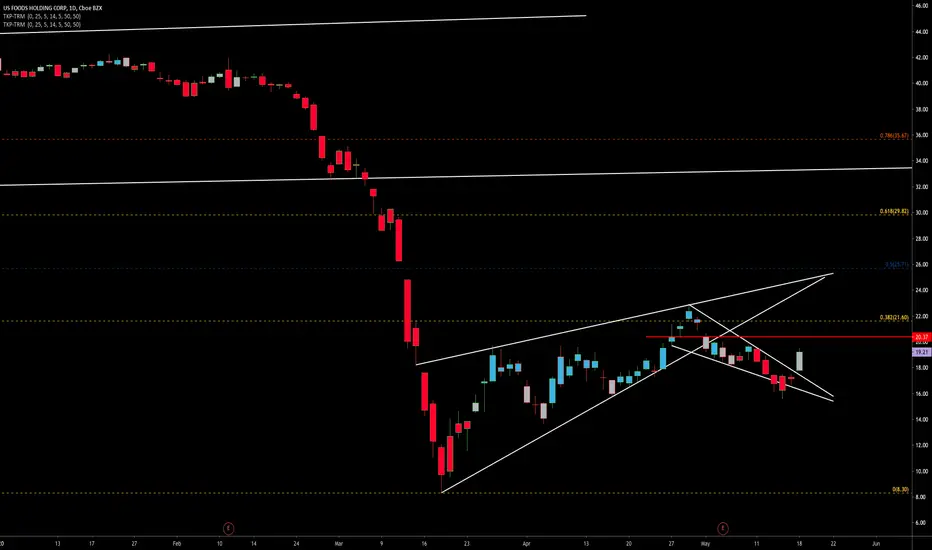
$USFD - FIB with rising trend$USFD - daily fib looking for $21.60 (38.2%). Current resistance $19.60ish with a steep rising LTL in play. Break of LTL we want to see mid $17s hold.

So People apparently dont need food because of CoronavirusTA + common sense= go long. People still need to eat and Covid-19 isn't going to change that. USFD is one of the largest food distributors in the US, distribution channels may change but this stock has long-term huge potential. Long-term play that provides a robust holding
*Personal interpretation, not investment advice

USFD - A Nice Little Surprise FindThis stock actually popped up on one of my daily scans that I run each day, and it came up on my BEARISH scan. However, once I zoomed out to the weekly chart I actually really like this as a weekly bullish play.
The weekly chart is trying to exit an oversold condition with little volume resistance overhead. It has broken out of a bullish wedge pattern after creating a bit of a flag pattern prior. I have my potential price targets noted on the chart. If you wanted a better entry, the price may fall for a little in the near-term as it did pop up on my bearish daily scan but I would definitely keep this on a watchlist.

USFD Short opportunityThis stock is over stretched, weak management who base everything on the industry and does not have the energy or will to innovate. It has done well over the past few quarters, but insider activity tells of a lack of confidence in the stock.


$USFD Long term Support / Shor term triangleForming a triangle pattern paired with long-term support trendline.
Entry - $35.89
Stop in at $35
Target $39.


