WFC trade ideas

Wells long again?Not highly confidential if the pull back is done. But overall structure looks clean.


If it goes lowerIf it goes lower and breaks 52.85 it should go straight to the 100 MA on the weekly chart. I used the weekly chart because of the strong support of the 100 MA that would cause the stock to pause.


Wells Fargo - Short Term Sell OpportunityThe currencies market has been slow the last two weeks. This is where having a stock/equities portfolio comes in play.
Short term wise, we do have a sell opportunity on Wells Fargo, WFC.
Fundamental analysis
1) Revenue has been growing, but net income has been falling;
2) Operating cash flow and FCF dropped drastically; and
3) Both ROA and ROE has been dropping.
All these fundamental financial ratios are concerning for WFC.
Technical analysis
We have seen price completed a 5-wave structure, and is potentially still in a correction. Price made an impulse drop from 59.97 to 51.22 recently and has since been moving sideways. Looking at how price is currently developing, we are expecting one more move to the downside after one more push to the upside between 56.18 to 57.84 region.
Potential target for the short term sell opportunity will be around 48.84 to 49.85 area.
**Do you own due diligence as this is simply one perspective of the market.


WellFargo Buy IdeaD1 - Range.
Ideally we want to see another push down towards the very bottom of the range creating and completing divergence
Then we want to see higher highs and/or trend line breakout to the upside to go ahead and buy.
Invalidation - Skip the setup, if price pushes higher towards the top skip the setup or If price breaks below the bottom and confirms the breakout.


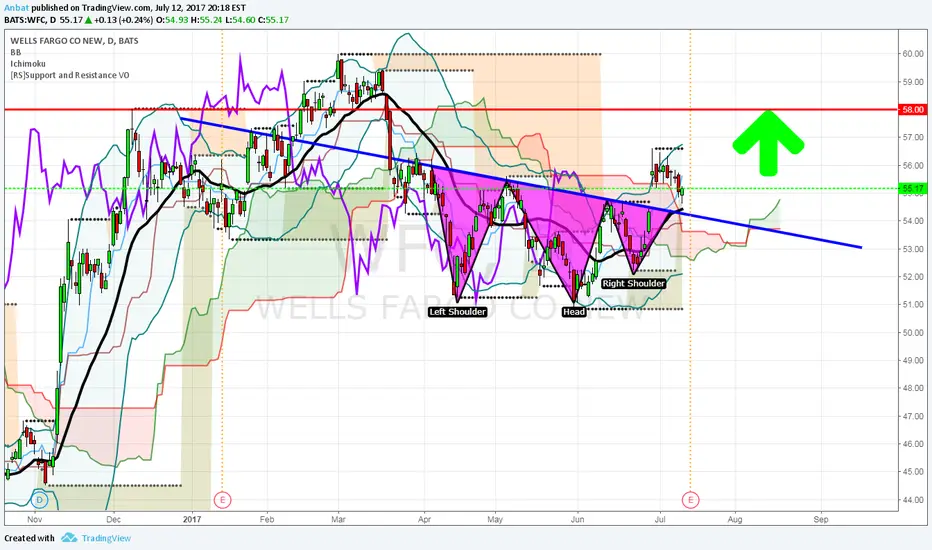
WFC- Bullish (H&S Pattern)Write Covered Call:
1) Buy 100 shares/$5517.00
2) Write 25th Aug $57 call
Premium/Credit: $71 (0.71 x 100)
3) Max. return: $254 at $57 expiry
4) Always, put a stop loss: $54.50/if hit then buy & get out.
Remember: You want expires from 30 days to 60 days, ideal is 45 days (around)
*If $57.00 is not hit by 8/25/17, then write another covered call.
Testing a weekly resistance zone before earningsWFC is testing the top of a consolidation range before earnings.
WFC has been consolidating since it broke below a weekly uptrend line.
Bearish? Short as long as below 60$
Bullish? Buy the breakout?


All's Not Well At Wells FargoOn May 5, 2017, the Wells Fargo & Company WFC 50 day moving average crossed below its 100 DMA. Historically this has occurred 61 times and the stock does not always continue to drop. It has a median loss of 4.438% and maximum loss of 23.427% over the following 24 trading days..
When we take a look at other technical indicators, the relative strength index (RSI) is at 53.1379. RSI tends to determine trends, overbought and oversold levels as well as likelihood of price swings. I personally use anything above 75 as overbought and anything under 25 as oversold. The current reading has the stock moving lower. The RSI has been trending lower since November 2016. Even though the RSI typically cycles between overbought and oversold levels, that has not necessarily been the case with this stock. Overall the RSI is failing to make newer highs which is another significant signal of downward movement. This overall downtrend should continue as long as the RSI stays below this trendline.
The true strength index (TSI) is currently -12.8863. The TSI determines overbought/oversold levels and/or current trend. I solely use this as an indicator of trend as overbought and oversold levels vary. The TSI is double smoothed in its calculation and is a great indicator of upward and downward movement. The current reading declares the stock is down.
The positive vortex indicator (VI) is at 1.0788 and the negative is at 0.6624. When the positive level is higher than 1 and higher than the negative indicator, the overall price action is moving upward. When the negative level is higher than 1 and higher than the positive indicator, the overall price action is moving downward. Currently the stock had been moving up, however, it has begun its reversal downward.
The stochastic oscillator K value is 80.2266 and D value is 81.8878. This is a cyclical oscillator that is highly accurate and can be used to identify overbought/oversold levels as well as pending reversals and short-term activity. I personally use anything above 80 as overbought and below 20 as oversold. When the K value is higher than the D value, the stock is trending up. When the D value is higher that the K value the stock is trending down. Currently the indicator is in overbought territory and the downtrend is beginning. The stock has a history this year of easily swinging up and down three-plus percent when overbought and oversold.
Considering the moving average crossover, RSI, TSI, VI and stochastic levels, the overall direction appears to be pointing down. Based on historical movement compared to current levels and the current position, the stock could drop at least 3% over the next 24 trading days. The trend, MA crossover, RSI, VI, and stochastic strongly support this pending downward skew.


Wells fargo & company *Buy opportunity*Wells fargo & company .
Bank manipulation trading & bank strategic analysis
Buy opportunity
Low risk

Well Fargo & co. Buy opportunityYou have buy opportunity .
Low risk investment.
Big volumes size lot trading kill your account one day definitely.
Money management and low risk are other key for succès .
Trade with care

WELLS FARGO and JPMORGAN CHASE UPDATE. I told you guys I couldn't afford two trades going against me. Am I worried about my WFC bull spread? A little. NOT because I think WFC is on a downward spiral BUT because I don't know if it'll get in my range in time (53ish). It won't stay down for long that I do know. I just hope it does it in time. I have a lot of trades going against me. WFC, HLF, and EBAY (I got into it by accident, LONG STORY) but anyways i'm optimistic about all of my trades (maybe not EBAY, i'm neutral on it by the way) we shall see. So far I got two winner trades this year. URBN and LULU. I'm going to keep on keeping on. Atleast I knew JPM was going down on earnings. I did underestimate WFC though but it wasn't slaughter. JPM's hit was a bit more blunt and I also expect JPM to go up, even faster than WFC although I know banks follow eachother, but WFC can't catch a break. NOT LIKE THEY DESERVE IT!! THEY WONT EVEN HIRE ME! haha
