X trade ideas

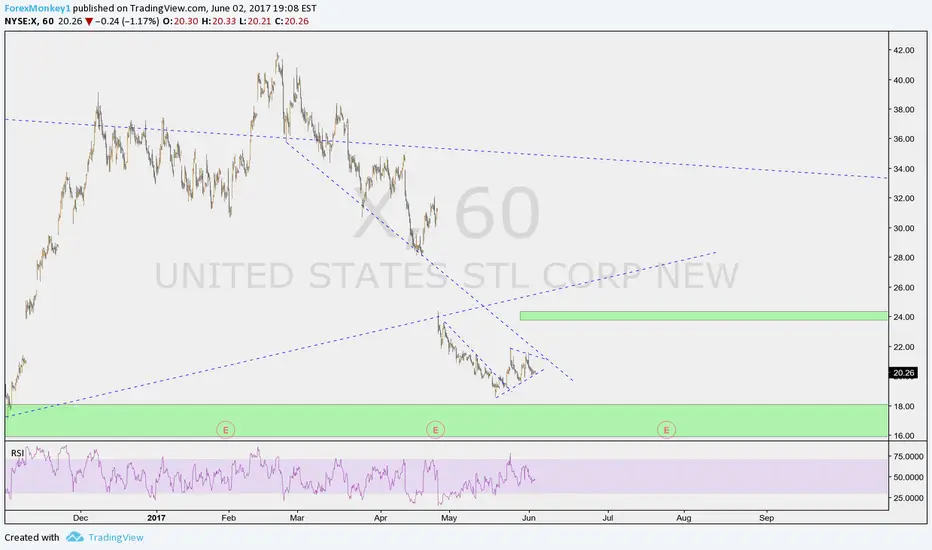
XUgly end to this week, but as expected the breakout failed by EOW. Every attempt higher since 18.54 was followed by a pullback to .61-.78 and so was this one. Not sure yet if this can resume higher to close the gap around 30, but it may do so or come down to test 18.54. Fundamentals seem mixed and sentiment is suddenly negative despite positive ER. This may present some interesting longer term buying opportunities - on watch.

X, uptrend. reversal and breakoutI think X is looking great. broke out on Tuesday. pulled back today with kind of low volume for a long candle. I am expecting a reversal tomorrow, and a break out afterwards. Let me know what do you think. Good Luck


Short PutVolatility in $X is still up yet from earnings.
Sept 15 $23 puts @ .64. 2.78% ROC in 51 days, possibly sooner if we get some drawn out quickly.

$XBreakout to a high of $24.10 Thursday, Friday great short back to $23.20 (i sold off 50% position at $23.97 - should have sold and shorted) Let's see what happens Monday. I think momentum takes us to $24 shortly before earnings. $23.20 has to hold early next week or we're back to $22.50 or lower. Lot's of upside, good short term support but be careful of earnings. Could blast off to $28+


Short term bullish XNice bounce from resistance today. I see riding to test resistance. If breakout past $24 roll to $28.

X Reaching Bottom of ChannelBasically X is in a bullish channel, confirmed by the retest on 6/15/17 as support. On 7/6/17 X closed below the channels midpoint, which should have warned investors of a possible lower day on 7/7/17, which did happen. The weekly MACD is still at the crossroads and bearish volume seems to be waning, with bearish volume the being the lowest since 12/26/17 (weekly).
May reach the top of the channel again around 7/21/17 with a $23.8x price target, which equals a 14% potential gain as of the time of this writing.


X tested necklineX has tested the neckline as I wrote last night. I'm in at 22.60. Using $22 as a stop loss. Looking to see if it rallies off today's lows.


X to test necklineX made a double bottom with a test of the neckline soon. Confluence of neckline and MA meeting could be a long setup. If neckline fails, a good short setup.

Lucy pulled football again.Don't give up Charlie Brown. 28 easy after 24 breaks. Whipsaw headfake on 50day MA crossing.

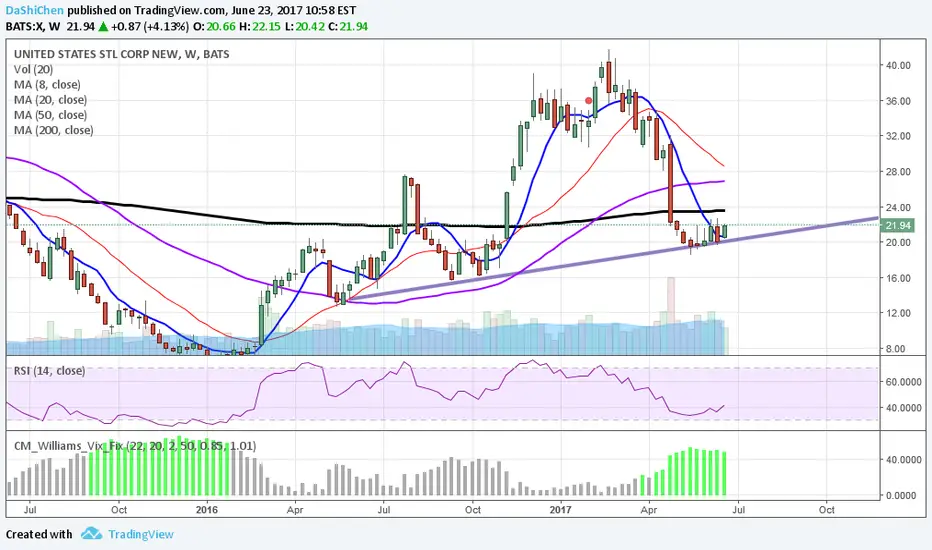

X- Big Huge Cup/Handle PatternOn weekly X stock, believe that big huge cup and handle pattern is about completed. Will be looking at buying shares and/or selling covered calls soon. PA is at a key reversal area or support on fib. retracment of .618 (holding for last 5 to 6 weeks). How to trade, on breakout of handle with bullish price reversal candlestick pattern (HARAMI, ENGULFING AND/OR PINBAR), support area of $20.00 (which is right now). Remember basic materials, will be stable at this time.