X trade ideas
$X Good HBD on 4h and daily MACD/RSI$X Good HBD on 4h and daily MACD/RSI. Not sure if anyone else in FTM already posted this or not. Would target a previous resistance. Could potentially turn into an HS if it pulls back there. Easy risk management. R/R5

𝗨𝗦 𝗦𝘁𝗲𝗲𝗹 𝗨𝗽𝗱𝗮𝘁𝗲: $X Daily. Hammer TimeTrying to hammer off of the TL. Back over the 50dma and could rip
$FCX $AKS $MP $HG_F $SPY $SPX $ES_F $TNX $TLT $ZB_F $ZN_F #Economy #Commodities #Inflation

X cup and handle back from 2019Could break to the upside once it breaks the current downtrend. I see a c&h back from 2019. could mirror the chart.


Will X Continue Its Uptrend?X looks good holding above $16. Price may sweeps low before heading higher.

XMID-TERM; At horizontal support and .786 fib retracement. Hidden bullish divergence developing on 4hr and daily.

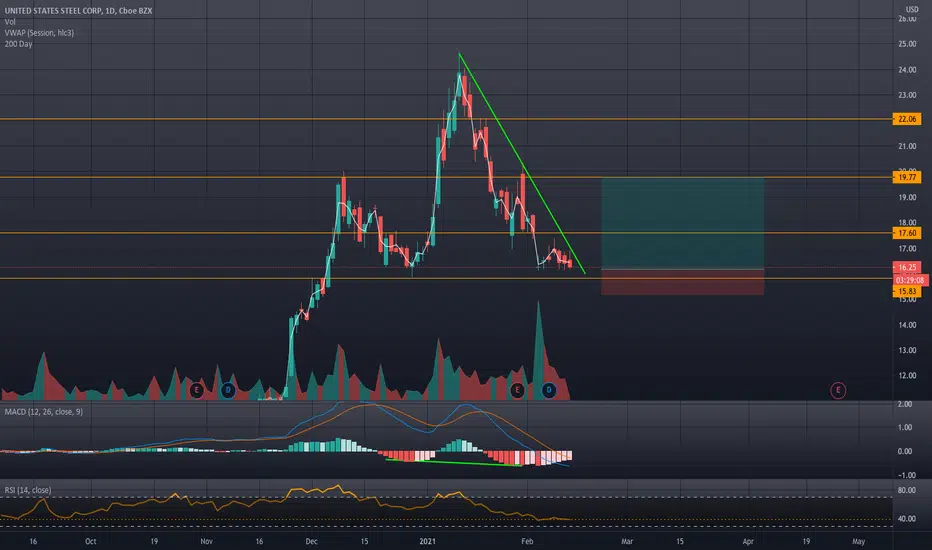
X short then longOn the weekly chart X looks like its capped out according to the VWAP. On the daily chart its also looking like it'll test the top of the ichimoku cloud.

Fill the gap and down we goHuge offering after head and shoulder pattern formation. I'm seeing downward movement from now on.

Could wave (4) be a triangleTriangles are a correction five-wave pattern and a triangle could be formed in a wave four in an impulse or wave B in a zigzag. Alternation guideline and the channel technic bring the triangle idea in my mind and I expect to see the completion of this wave on the end of April or the first week of March.


X Looks like a great Year-long PlayInfrastructure stocks surged recently and are beginning to retrace a bit. While the Stochastic indicator appears to be breaking down, the trend is strong and the cyclical nature of the stock leads me to believe that this is something I want to hold in my portfolio. For cheap plays, I'm looking to add Jan 22 25-35 calls. At 1.60 to 1.80, given the trend line projection, some profit seems assured. If any infrastructure legislation goes through, this stock could easily see 40, but even that would appear to be base-building. Have a pilot position already before it surged but will start adding some call spreads here and should we get more decline, which is quite possible as the overall market is starting to look weak, I'll add more.
I plan to update my thoughts on X throughout the year. So stay tuned.

United States Steel - 2021 infrastructure playUnited States Steel - 2021 infrastructure play
52 week:
High 23.86 on Jan 12, 2021
Low 4.90 on Mar 18, 2020
Avg 9.66 for past 1 year
Do your own due diligence, your risk is 100% your responsibility. You win some or you learn some. Consider being charitable with some of your profit to help humankind. Small incremental steps work : If you double a penny a day for a month it = $5,368,709. Good luck and happy trading friends...
*3x lucky 7s of trading*
7pt Trading compass:
Price action, entry/exit
Volume average/direction
Trend, patterns, momentum
Newsworthy current events
Revenue
Earnings
Balance sheet
7 Common mistakes:
+5% portfolio trades, risk management
Beware of analysts motives
Emotions & Opinions
FOMO : bad timing
Lack of planning & discipline
Forgetting restraint
Obdurate repetitive errors, no adaptation
7 Important tools:
Trading View app!, Brokerage UI
Accurate indicators & settings
Wide screen monitor/s
Trading log (pencil & graph paper)
Big organized desk
Reading books, playing chess
Sorted watch-list
Checkout my indicators:
Fibonacci VIP - volume
Fibonacci MA7 - price
pi RSI - trend momentum
TTC - trend channel
www.tradingview.com

United States Steel ($X) Long $22 to $38United States Steel is heating up!
Entry: $22
PT: $38 by EOQ2


Next leg up for X Bouncing off of the trend line and getting heavy NYSE:X 4/16 $25 dark pool options.


dip is on the uptrend is now!nice trend channel its started ever since it found its bottom last year, dip entry 20, stop loss 18, price target 24, decent risk reward here! goodluck to all longs :)

X short (temporally)Expect further declines to convergence level at appx 20.12. Then load up more (I'm long X).

+50% Bullish Move coming on XGood morning traders, today we want to show you our bullish projection on X, since we consider that it has excellent potential for the medium-long term.
🔸To achieve this analysis, we draw the corrective pattern on the monthly chart that has been taking shape since the great fall of 2008, it is a kind of wedge.
🔸The main characteristic of the wedges is that they are composed of 5 ABCDE waves, and in the current figure we see that 4 of the 5 have been formed.
🔸Wave D generated a double bottom in the previous support zone, and since then the price has been rising aggressively, which shows a lot of buying strength in this stock.
🔸We consider that wave E is happening right now, and the target zone corresponds to the Descending Trendline, which is in confluence with a supply zone.
🔸This upward movement corresponds to a rise of approximately 50% in the price.


