Possible short setup XLBHey y'all,
On XLB, there is little to suggest that we aren't going to have a counter-trend rally in July. That being said, there are even fewer things suggesting that said rally would not be faded, though predicting where exactly the rally will be faded is an incredibly difficult task. If it somehow manages to push its way up to $82/share, I think it would be an incredible short, though I think it may only make it to around $80. Good luck with your trading!
XLB trade ideas

XLB materials broke 78, the 2021 support; 70 or 57 may be nextThe worst may not be over. A 8% inflation is very hard to fight even with monetary & fiscal policy because the FED could only control the demand side & not the supply side of inflation. With the FED making it very clear that it wont stop until inflation comes down, we may be seeing aggressive rate hikes leading to layoffs & demand destruction in the near future & in turn causing a decline in manufacturing & materials.
XLB just lost the 78 (Fib 0.236) impt support since 2021. The next stop to watch very carefully is the Fib 0.383 pivot zone @70. This may come sometime in late August or early September 2022.
Make-or-break zone: if 70 fails, then 64 (Fib 0.50) will offer not much support till 57 which is the pre-pandemic zone. This scenario will end the ABC correction sometime in November or in the last Quarter of 2022.
Not trading advice.

Since inception, each SPDR select sector. this is each SPDR fund since inception in 1998. Each sector is materials, energy, finance, industrials, technology, essential goods/services, utilities, healthcare, and non-essential goods/services. We can see how Energy looks as if there is more room to run which means more pain for stocks be careful traders and investors alike.

Materials look promissingGood point for a rebounce. Chemicals look especially nice. But it's still a sideways movement, needs to breakout either way

Materials need a bounce backMaterials have benefited from late cycle, but lately they they underperformed and now need a good bounce back

XLB Nearing DECADE Long 2.618 ExtensionTrading plan on chart. Need a break and retest of the $94 area before adding positions. Favoring a corrective wave to add new positions. Earnings season could be the catalyst to spike into an ending diagonal (pointed out on chart).
This could be one of the top sectors for 2021 but I'd like to wait for a pullback to add.
If you get anything from this post please like and share. Start the conversation/debate in the comments :)
Cheers and happy trading!
Casey

$XLB Materials looking overbought!Conviction: 4/5
General Thesis
reaching long-term upper bound on channel (2007)
Weekly RSI showing bearish divergence
weekly MA look like they might be turning over
Timeframe: 1 year-ish
Growth
N/A
Value
N/A
Fundamentals
N/A
Potential Risks
continued inflation + seller pricing power
could go on for longer

XLB Daily TimeframeSNIPER STRATEGY
This magical strategy works like a clock on almost any charts
Although I have to say it can’t predict pullbacks, so I do not suggest this strategy for leverage trading.
It will not give you the whole wave like any other strategy out there but it will give you huge part of the wave.
The best timeframe for this strategy is Daily, Weekly and Monthly however it can work any timeframe above three minutes.
Start believing in this strategy because it will reward believers with huge profit.
There is a lot more about this strategy.
It can predict and also it can give you almost exact buy or sell time on the spot.
I am developing it even more so stay tuned and start to follow me for more signals and forecasts.

Materials 25.08The setup is hinting at resistance breakout with Stoch rising and higher lows in place


Bias more on upside. The U.S. Senate voted to advance a $1 trillion infrastructure package on Saturday.
XLB may be benefited from this package.
Bias on the upside.
TP: $89
Trade Safe


XLB vs SPYMaterials sector vs SPY. Metals and mining starting to look a lot better. Ive been holding FCX for months. Also have some positions in silver. Will continue to watch.

Material OutperformanceXLB Materials ETF will outperform the SPY. Cyclical stocks are on fire right now and likely to outperform for at least the next 1-2 years.
XLB breaking out from trend line

XLB Put credit spreadEntered 4/7/2021 15:33 at green arrow - back logging the trade, not at expiry yet
Higher timeframe trend is up
Price making weak tops and buyers defending the proximal demand zones
Price coming back into +1 sigma
At base of hourly demand
Potential buyers stepping in, enough to cause a time delay
77.50 sold strike is AT higher timeframe demand zone proximal edge
Also at hourly flip zone and hourly continuation RBR continuation pattern for defense
Put credit spread 19% ROI, 9 DTE

My FCX forecastFCX is on the a bullish run; however, I think the fuel will run out on earnings. The reason I'm slightly bearish on FCX is because XLB needs a drop to complete what seems to be the formation of a running flat Elliott correction wave. I cant time it perfectly but I expect a drop in XLB a few days before the earnings annoucnement of FCX.
If you like what you see why not support us?
👇

XLB🌦In order to understand the market I rely on sectors. It's important to get a good read of each sector that relates to your stock of interest. Understanding the general direction of the market is easier than relying on indicators. No strategy is infallible, I just prefer to proceed accordingly.


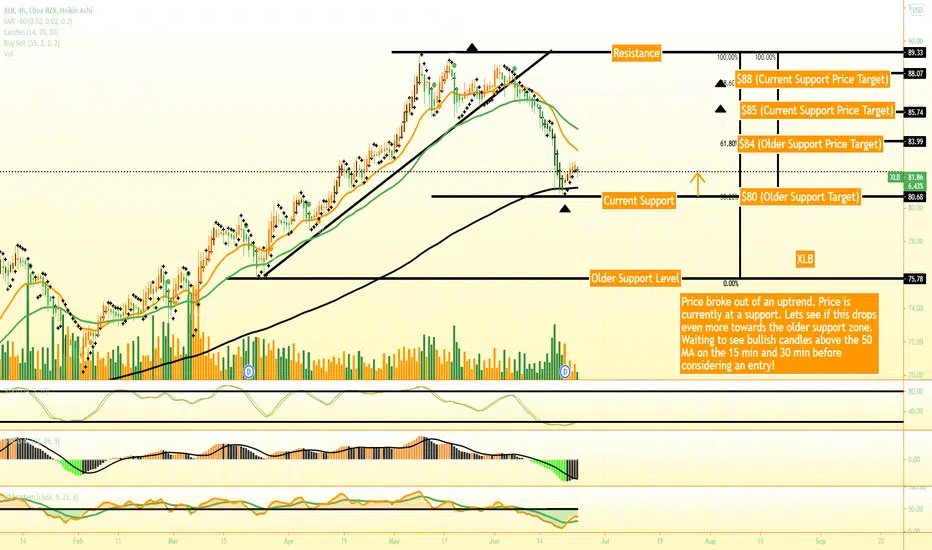
Pls come drop and pick me upPls come drop and pick me up
must get LTF Confirmations to enter!
i will personally be watching a lot of sectors as they are making interesting Price Action!

