Industrial ETF May Face ResistanceThe SPDR Select Sector Industrial ETF dropped in early April, and some traders may expect another push to the downside.
The first pattern on today’s chart is the March 13 low of $128.26. XLI peaked $0.44 under that level this month, which may suggest old support has become new resistance.
Second, the 50-day simple moving average (SMA) recently had a “death cross” below its 200-day SMA. That may suggest the long-term trend has gotten more bearish.
Third, the stochastics oscillator’s leading line crossed under the smoothing signal line.
Fourth, the 8-day exponential moving average (EMA) has remained under the 21-day EMA.
Finally, XLI hit a 52-weeek low of $112.75 on April 7. Is a retest of that support needed?
Standardized Performances for the ETF mentioned above:
SPDR Select Sector Industrial ETF (XLI)
1-year: +4.06%
5-years: +122.11%
10-year: +135.02%
(As of March 31, 2025)
Exchange Traded Funds ("ETFs") are subject to management fees and other expenses. Before making investment decisions, investors should carefully read information found in the prospectus or summary prospectus, if available, including investment objectives, risks, charges, and expenses. Click here to find the prospectus.
TradeStation has, for decades, advanced the trading industry, providing access to stocks, options and futures. If you're born to trade, we could be for you. See our Overview for more.
Past performance, whether actual or indicated by historical tests of strategies, is no guarantee of future performance or success. There is a possibility that you may sustain a loss equal to or greater than your entire investment regardless of which asset class you trade (equities, options or futures); therefore, you should not invest or risk money that you cannot afford to lose. Online trading is not suitable for all investors. View the document titled Characteristics and Risks of Standardized Options at www.TradeStation.com . Before trading any asset class, customers must read the relevant risk disclosure statements on www.TradeStation.com . System access and trade placement and execution may be delayed or fail due to market volatility and volume, quote delays, system and software errors, Internet traffic, outages and other factors.
Securities and futures trading is offered to self-directed customers by TradeStation Securities, Inc., a broker-dealer registered with the Securities and Exchange Commission and a futures commission merchant licensed with the Commodity Futures Trading Commission). TradeStation Securities is a member of the Financial Industry Regulatory Authority, the National Futures Association, and a number of exchanges.
TradeStation Securities, Inc. and TradeStation Technologies, Inc. are each wholly owned subsidiaries of TradeStation Group, Inc., both operating, and providing products and services, under the TradeStation brand and trademark. When applying for, or purchasing, accounts, subscriptions, products and services, it is important that you know which company you will be dealing with. Visit www.TradeStation.com for further important information explaining what this means.
XLI trade ideas

Nov 1, 2024 Pre-Election Modeling UpdateThis video highlights the work I did on November 1, 2024 using my ADL predictive modeling system. We are now 3+ months past the Nov 1, 2024 modeling date and the SPY SPDR sectors are showing various stages of completion related to the ADL predictive price levels.
Some are higher. Others are lower. Some are right in the middle of the predictive ranges for Feb 15, 2025.
The reason I'm providing this update is to keep you informed of the variance in longer-term predictive data and how new updated data shows the SPY should stay somewhat solid above 570-580 over the next 60= days while the QQQ may fall to levels near 495 to 470 over the next 60+ days.
When you are attempting to trade, the best information you can get is something that helps you identify what is likely to happen in the near future.
Predictive modeling is all about using current data to try to predict future data ranges and actions.
Get ready; the next 3+ years will be incredible for skilled traders.
#trading #research #investing #tradingalgos #tradingsignals #cycles #fibonacci #elliotwave #modelingsystems #stocks #bitcoin #btcusd #cryptos #spy #es #nq #gold

Bulish XLi we have a cdv divergence and a 50 sma supportafter several days of decline, XLI is finding support on the 50 sma and there is a CDV divergence. the stop loss is clear and not far from the entry point.
Elliot wave : after an M correction the 5 wave is about to begin

Industrial ETF: Potential BreakoutIndustrial stocks have been rangebound for most of the year, but now they might be breaking out.
Today’s weekly chart features the SPDR Select Sector Industrial ETF, which holds stocks in groups like aerospace, general manufacturing, transportation and construction. The main pattern is the pair of lines at $120 and $126.
The lower price was near a weekly low in late February. XLI bounced there again in mid-April and mid-June. Sellers tried to break it last week but failed. The resulting false breakdown is a potentially bullish reversal pattern.
Next, peaks occurred around $126 in early April and mid-May. XLI tried to break out in late July before getting swept lower with the broader market. But now it’s back above the old resistance. It’s also on pace for a potential record weekly close, which could interest some longer-term momentum players.
Finally, retail sales have beaten estimates for two straight months and jobless claims have eased after increasing in June and July. That stronger economic backdrop may favor industrials, which are mostly viewed as cyclicals.
Standardized Performances for the ETF mentioned above:
SPDR Select Sector Industrial ETF (XLI)
1-year: +15.79%
5-years: +64.30%
10-year: +146.69%
(As of July 31, 2024)
Performance data shown reflects past performance and is no guarantee of future performance. The information provided is not meant to predict or project the performance of a specific investment or investment strategy and current performance may be lower or higher than the performance data shown. Accordingly, this information should not be relied upon when making an investment decision.
TradeStation has, for decades, advanced the trading industry, providing access to stocks, options and futures. See our Overview for more.
Past performance, whether actual or indicated by historical tests of strategies, is no guarantee of future performance or success. There is a possibility that you may sustain a loss equal to or greater than your entire investment regardless of which asset class you trade (equities, options or futures); therefore, you should not invest or risk money that you cannot afford to lose. Online trading is not suitable for all investors. View the document titled Characteristics and Risks of Standardized Options at www.TradeStation.com . Before trading any asset class, customers must read the relevant risk disclosure statements on www.TradeStation.com . System access and trade placement and execution may be delayed or fail due to market volatility and volume, quote delays, system and software errors, Internet traffic, outages and other factors.
Securities and futures trading is offered to self-directed customers by TradeStation Securities, Inc., a broker-dealer registered with the Securities and Exchange Commission and a futures commission merchant licensed with the Commodity Futures Trading Commission). TradeStation Securities is a member of the Financial Industry Regulatory Authority, the National Futures Association, and a number of exchanges.
TradeStation Securities, Inc. and TradeStation Technologies, Inc. are each wholly owned subsidiaries of TradeStation Group, Inc., both operating, and providing products and services, under the TradeStation brand and trademark. When applying for, or purchasing, accounts, subscriptions, products and services, it is important that you know which company you will be dealing with. Visit www.TradeStation.com for further important information explaining what this means.
Exchange Traded Funds ("ETFs") are subject to management fees and other expenses. Before making investment decisions, investors should carefully read information found in the prospectus or summary prospectus, if available, including investment objectives, risks, charges, and expenses. Click here to find the prospectus.


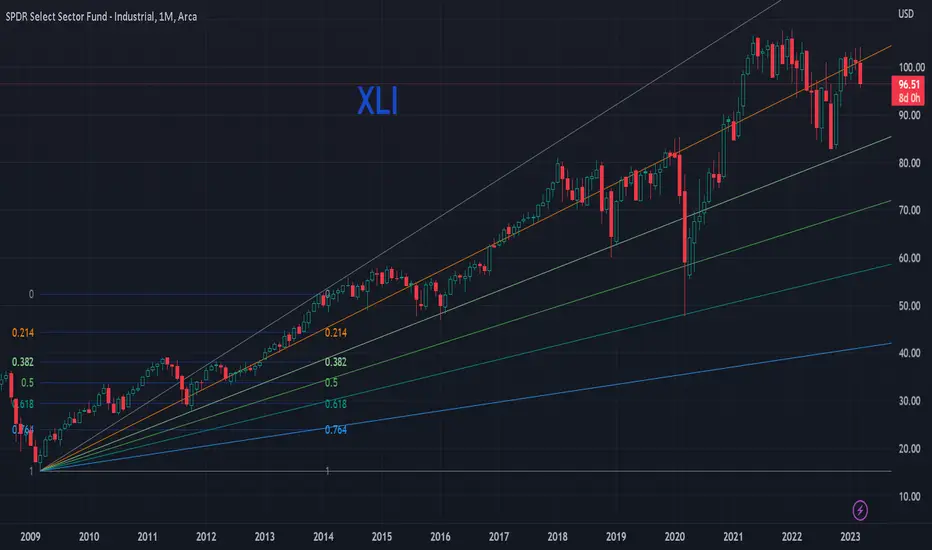
XLI Weekly Chart Here's the industrial sector being strong then ever, 11th straight green weekly candle. Last week's candle made a strong push and close above the 1.618 Fibonacci level. This is some market we've been having. What do you guys think here? Think this market can take us to the next Fib level? IDK but we shall see.

Business Cycle Rotation Part 6: ConclusionsTo Recap:
In parts one and two we used MACD monthly perspective momentum across a large number of tradable assets to produce a matrix of tradable assets, and then to distill an overview of each category's momentum state.
The raw data is placed in the quadrant most consistent with the combination of the MACD momentum state and its price trend.
The raw data is distilled into 7 categories and placed into the position in the matrix that best describes the majority of the group.
Part three illustrated using the Organization for Economic Co-operation and Development (OECD) Composite Leading Indicator (CLI) for the United States plotted in conjunction with the assets from the matrix to view the economies and position in the business cycle and the markets position in the market cycle.
To better visualize the cycles, the data is also placed in stylized business and market cycle diagram.
In part 4 we focused on the changes between the end of 2022 and the end of 2023 with a focus on the rates market.
After considering the weight of the evidence presented in the first four installments of this series:
Business Cycle: Despite the great Q3 2022 GDP print and above trend GDP growth over the 4 quarters ending with September 2023, the business cycle continues to gradually weaken. This can be seen in the chart of the Organization for Economic Co-operation and Development (OECD) Composite Leading Indicator (CLI) for the United States.
Rates: Led this business cycle lower (as one would expect) and it is likely that they will lead the next business cycle higher. Short rates (inverted to place on the same scale as price) may be turning as they have lost their momentum and are threatening to turn higher in price (lower in yield). A confirmed turn would suggest that a recession (probably in excess of the current soft landing narrative) had arrived.
It is important to note that since early 2021, short rates have risen significantly more than long rates. This created the type of yield curve inversion that has historically signaled a coming recession. Over the last three months short rates have fallen significantly, flattening the curve back toward un-inverted.
I view the initial inversion as a "something odd is happening" warning. What captures my undivided attention is a rapid reversal (back to normal) in which short rates fall more quickly than long rates and the curve moves back into it's normal, positively sloped, configuration. When this happens, a recession is only a few months away. For now, the curve has moved sharply toward normalization, but still hasn't moved above 0 (flat).
Equities: I have equities in the "strong decline" quadrant (explanation in part two of the series). While the rally of the last three months does call this view into question, the positioning of rates, the CLI position, and the positions of commodities all tend to support the view. Note that the NYSE Comp is still significantly below its early 2022 cycle high.
Importantly, equities are typically strong, often setting new highs, just prior to a recession and that they subsequently trough during or just after a recession. As the recession matures, technical lows in equity charts generally offer important entry points to positional longs.
I will repeat again, new highs imply very little about the likelihood of an economic recession.
To believe that the US is going to escape a recession, one would need to embrace the soft or no landing thesis. This is not my base case. But, the best argument for that outcome is the M2 money supply regression chart discussed in part 5. The existing stock of money offers a strong argument that this time may be different, or at least delayed.
The next best argument is that AI is going to provide immense, immediately available improvements in productivity and immense technological gains. But, I think this is an argument for the business cycle that follows the next recession.
Once the recession matures, lower rates will eventually lead to better equities, higher commodities, and an improving business' cycle. As the flight-to-quality runs its course and the economic cycle becomes more normal the DX will begin influencing commodities again. The Dollar and commodities TEND to trend in opposite directions but the Dollars relationship to other asset classes and the cycle is highly variable. Commodities charts remain consistent with a weaker business cycle.
The Dollar index remains mired in the center of both a long term trading range and an multi year channel. This period of generally trendless trading may be ending as volatility has broken above a 40 year down trendline, and is finally making a higher low and a higher high.
Conclusions:
The weight of the evidence (even with the SPX/Tech rally) remains consistent with a weakening business cycle that has yet to enter recession.
Rates: The violent decline in short relative to long rates over the last three months is normalizing the curve. Market driven short rates generally lead and the Fed the Fed Funds rate follow. A positive sloped curve (long rates higher than short rates) would strongly suggest that a recession was likely in coming months.
Equities: Generally peak prior to a recession before correcting significantly during the recession. Recessions typically provide excellent entry points for equity and risk asset investors.
Commodities remain consistent with a weakening business cycle.
Man plans, God laughs.
And finally, many of the topics and techniques discussed in this post are part of the CMT Associations Chartered Market Technician’s curriculum.
Good Trading:
Stewart Taylor, CMT
Chartered Market Technician
Taylor Financial Communications
Shared content and posted charts are intended to be used for informational and educational purposes only. The CMT Association does not offer, and this information shall not be understood or construed as, financial advice or investment recommendations. The information provided is not a substitute for advice from an investment professional. The CMT Association does not accept liability for any financial loss or damage our audience may incur.


Industrials Breakout $XLIXLI Breakout with $130 Target
XLI tends to have big sloppy consolidation trends over 3 year periods
Then it breaks out for 20 point moves higher
XLI recently broke out above $111 August highs, retested, and continued higher
Chart has ridden 9dma higher since early Nov
RSI stretched short term
Would like to see consolidation here at highs before next leg up
Measured move takes XLI to $130 in 2024
*thx @shaneaus for measuredmove script

Visualizing Business and Market Cycles Through Market Momentum 2Last year I produced several posts that described an exercise that utilizes long term momentum changes between asset classes and the relationship among asset classes to anticipate the business cycle. That series and part 1 of this series are linked below.
Methodology: Individual markets and ratios are plotted in the quadrant that best describes their combination of momentum and price trend. The precise point where the individual plots fall in the matrix is not nearly as important as the overall pattern of multiple plot points and the weight of the evidence. The quadrants reflect the relationship between the 13 and 26 month exponentially smoothed averages.
Part one of the series described the general methodology and presented the matrix with the raw data. In this piece we consolidate the individual data points and begin to draw conclusions around the economy's position in the current business cycle.
This is the raw data plot. Its important to remember that each asset placement in the matrix is determined by the combination of momentum state and price behavior. In other words there is a strong subjective aspect in the placement that is subject to all the normal behavioral biases. I have no doubt that the matrix would look somewhat different had someone else produced it. In my opinion the more important takeaway is not where any individual asset falls within the matrix but where the general pattern produced by like assets falls within the matrix.
My placement of the equities within the matrix offers a good example. I generally have the equities in the lower right quadrant (strong decline/bear market). This despite SPY MACD momentum having moved into the MACD advancing quadrant. I have left it in the bear market quadrant because, A) Price is still significantly below last years high. B) The equal weight SPY and NYSE composite have not displayed similar strength. C) My read of macro conditions is still bearish (this is where behavioral bias can really make a difference in where the assets are placed). Point being, the work is a combination of quantitative and qualitative and clearly has a subjective aspect.
After placing the individual assets in the matrix I then distill them into 7 categories and place them into the position in the matrix that best describes that group. Remember that individual auctions, sectors, etc. may be in far different positions than the bulk of the category but the distillation is a weight of the evidence process meant to identify the approximate position of the bulk of similar auctions. More detailed distillations can separate industrial and agricultural commodities, and add bond market credit spreads, hyper cyclical and financial companies.
For comparison, I have included the distilled matrix from 2022:
In the next installment we will describe how the sectors interact over the course of a typical business cycle, plot the information onto a stylized business cycle and draw conclusions about the current cycle.
And finally, many of the topics and techniques discussed in this post are part of the CMT Associations Chartered Market Technician’s curriculum.
Good Trading:
Stewart Taylor, CMT
Chartered Market Technician
Taylor Financial Communications
Shared content and posted charts are intended to be used for informational and educational purposes only. The CMT Association does not offer, and this information shall not be understood or construed as, financial advice or investment recommendations. The information provided is not a substitute for advice from an investment professional. The CMT Association does not accept liability for any financial loss or damage our audience may incur

Visualizing Business and Market Cycles Through Market MomentumLast year I produced several posts that described a methodology utilizing long term momentum changes between asset classes and the relationship among asset classes to help anticipate the business cycle. That series is linked below.
When I worked in the institutional setting I would place hundreds of assets, ratios, spreads of individual corporate bonds and equities into a 4 quadrant MACD momentum matrix. I would then condense the raw data into thematic groups and see what the matrix implied about the business cycle. As an individual investor with limited time and fewer resources, I generally plot 80 assets and spreads and find that sufficient to extract a view.
For most of the last two decades the liquidity regime provided by monetary and fiscal policy disrupted the economies natural cycle. But, I believe that policy inflections have occurred and that asset prices will again become more connected to the real economy and less connected to policy. Analysis such as this will again become more useful.
Methodology: Individual markets and ratios are plotted in the quadrant that best describes their combination of momentum and price action. The precise point where the individual plots fall in the matrix is not nearly as important as the overall pattern of multiple plot points and the general weight of the evidence. It is important to realize that the momentum state is not always obvious. Accept that its messy and use your best judgement in deciding on quadrants. The idea is to build a general view of the market and economic cycle.
What defines the momentum quadrant? The monthly perspective moving average convergence divergence oscillator (MACD). The individual quadrants reflect the relationship between the 13 and 26 month exponentially smoothed averages.
Quadrant One: Waning Bear: In this quadrant momentum is bearish with the shorter average below the longer average, but the difference between the two is becoming less. Momentum is still lower, but at a decreasing rate.
Quadrant Two: Strong Advance: In this quadrant momentum is bullish with the shorter average above the longer average and the difference between the two is becoming greater. Momentum is higher at an increasing rate.
Quadrant Three: Waning Bull: In this quadrant momentum is bullish with the shorter average above the longer average, but the difference between the two is becoming less. Momentum is still higher, but at a decreasing rate.
Quadrant Four: Strong Decline: In this quadrant momentum is bearish with the shorter average below the longer average and the difference between the two is becoming greater. Momentum is lower at an increasing rate.
Trading Range: A market in a trading range is removed from the matrix until it breaks from the range even if MACD momentum has been falling/rising for months.
Over the next few posts, we will briefly address the construction of the matrix, and attempt to draw conclusions around the market and economic cycles. If you are interested in the methodology, please visit the links below for in depth discussion.
And finally, many of the topics and techniques discussed in this post are part of the CMT Associations Chartered Market Technician’s curriculum.
Good Trading:
Stewart Taylor, CMT
Chartered Market Technician
Taylor Financial Communications
Shared content and posted charts are intended to be used for informational and educational purposes only. The CMT Association does not offer, and this information shall not be understood or construed as, financial advice or investment recommendations. The information provided is not a substitute for advice from an investment professional. The CMT Association does not accept liability for any financial loss or damage our audience may incur.

XLI : No Buyers YetXLI has had a picture perfect breakdown.
We warned our members of this last week.
this pattern technically has more downside but it is very oversold and were approaching the breakout trend line as well as many weeks of consolidation & support.
A bounce is most likely as the daily chart is becoming exhausted to the downside.

XLI new downtrendthe 105.5 support is failing, and next stop should be around $100. increase in put volume as well.

XLI could be on the verge of breaking down. A close above the neckline negates the bearish pattern.
If Weak ISM data continues you could see more weakness in this sector.
A pair trade I'm watching is Long GE / Short XLI

Adding XLI Industrials to watch: Long
Relative Underperformer so far, and should start to outperform on relative basis

XLI: Poised to Break OutFundamental Analysis
While macro headwinds remain strong putting pressure on "infrastructure stocks," most traders are sitting short or flat "economy" based stocks. Any upside surprises will cause them to play catch up on the trade.
Strong run up in other sectors, especially Tech, will cause some rebalancing flows out of Tech (and probably stocks in general) into other sectors.
While macro data has been generally mixed, weakening PMI, but strong consumer and labor market outweigh that. Weakening PMI (less demand of new goods) may come from the inventory build up most companies did post Covid. This is probably the "bull whip" effect, once inventory gets sold down and consumer proves to be strong then there will be heavy demand for production again. Job growth is especially strong in blue collar areas.
Federal Reserve continues to seek to raise rates suggesting the economy is not as weak as one might think.
Recent passage of the Infrastructure Bill will prove to be supportive of this sector.
Technical Analysis
XLI has recently had a change of character suggesting it will continue its breakout
Effort/Distance (Volume needed to move the shares) has been very positive and bullish suggesting there is minimal free supply
Accumulation of the shares have competed (as per Wyckoffian Analysis)
Point and Figure Price target sets up an approximate 20-25% move up; considering this is a smaller sector in the S&P500 it will prove favorable in the event of a rotation of sectors.
Establishing long and stopping out if the thesis above breaks such as we cross back below the creek.
Charts are:
Left (Daily)
Top Right (Point and Figure)
Bottom Right (Weekly)

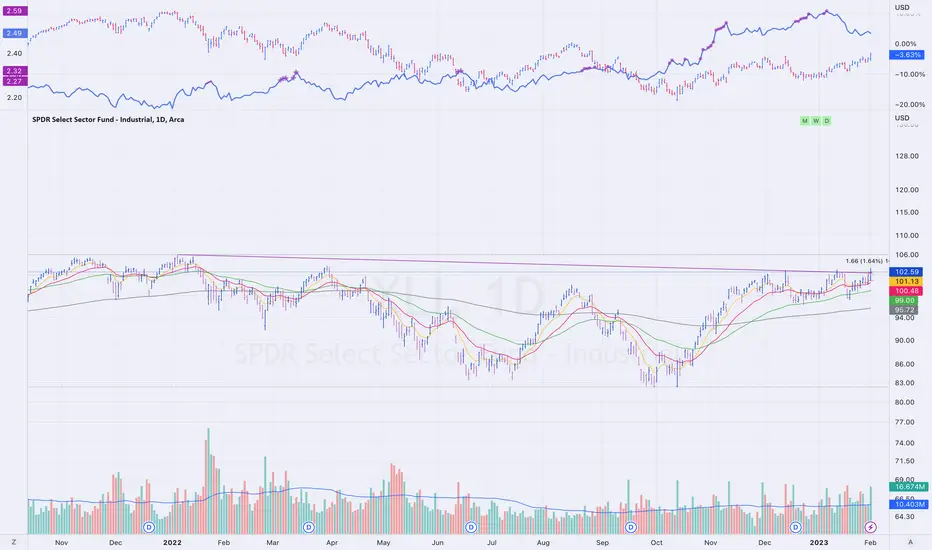
Technical analysis of XLI (Industrial Select Sector SPDR Fund)Technical analysis of XLI (Industrial Select Sector SPDR Fund):
XLI is an exchange-traded fund (ETF) that seeks to provide investment results that correspond to the performance of the Industrial Select Sector Index. The ETF's holdings primarily include industrial conglomerates, aerospace, and defense companies.
From a technical perspective, XLI has been trading in a broad range between 95 and 103 levels since August 2021. Recently, the price has been hovering near the lower end of the range, around the 97 level, which could be considered a demand zone.
In addition, the Relative Strength Index (RSI) is currently around the oversold zone, which indicates that the selling pressure may be exhausted, and buyers could take control of the price action.
Considering the above factors, it is possible that XLI could see a move higher from the current demand zone of 97. If the price manages to break above the resistance level of 100, it could confirm the bullish bias and open the doors to test the upper range of 103.
However, in case the price breaks below the support level of 95, it could invalidate the bullish outlook and lead to a further decline towards the next support level of 92.
Therefore, traders and investors should monitor the price action near the demand zone of 97 and the resistance level of 100 to determine the next directional move in XLI.

XLI is in a strong uptrendI noted a while back the bullish look for industrials, despite bearish sentiment in other sectors. XLI began its current bull trend at an intermediate bottom on 9/26/22, and really started a strong uptrend on 11/14/22. It sits well above the cloud on the weekly. XLI is poised to overtake it's 52 week high at 105.23 in the near future. From there, we can look at a new all-time high above 107.65. I am leery of a new all time high before the summer, since I am a firm believer of sell in may and go away. But I do expect a new all time high by the fourth quarter of 2023.

XLI green shoots61.8 % retrace and a successful Gartley reversal retest. Keep on watch for further upside. Along with SOX and XLF, these are green shoots that may lead SPY.

Bearish AB=CD on the SPDR Select Industrial Sector ETFThere is a Logscale AB=CD on the Industrials with Bearish RSI Divergence and the 1.414 PCZ of the Logscale AB=CD aligns with the 1.618 on the Linear Scale. I think it would be fitting to see this go down as i have recently become Bearish on Defesne Stocks such as RTX and HON, and have also become bearish on Airline Stocks such as BA and those stocks all happen to be in the top 10 holdings of this ETF so if they go down this ETF will go down. The standard Target for an ABCD like this is back to the C level which is around $47 in this case but for the time being i will target $80 via buying of the $90 Puts that are several weeks out.

Visualizing Business and Market Cycles Through Market Momentum 5Visualizing Business and Market Cycles Through Market Momentum 5: Conclusions:
In installments 1 - 4 we built a market momentum matrix and plotted the information onto a stylized business cycle. In this installment we will make final observations and thoughts around the current cycle.
Capital flows into and out of commodities, sectors and equities have historically provided a direct reflection of the markets view of the business cycle. But, over the last two decades the tsunami of fiscal and monetary liquidity distorted business and market cycles. As the liquidity lifted all asset classes analysis that depended upon normal intermarket relationships became less useful. Now that the reemergence of inflation as a threat is likely to constrain central banks. In other words, markets will again become properly anticipatory to the business cycle.
As a reminder, this is the distilled version of the momentum matrix we built in the first 3 installments.
This is the momentum stylized market and economic cycle sine curves. If markets (dark blue curve) are correctly anticipating the business cycle (grey curve) the business cycle is moderatly past peak, and should be expected to steadily deteriorate over coming quarters.
Observations:
The matrix is entirely consistent with an weakening business cycle that has yet to trough. Over the last two years rising short and long rates led the cycle lower. Equities, responding to higher rates, turned lower this year and both industrial and aggricultural commodities are now weakening as economic demand wanes. The outlier is the Dollar. It has benefited from global flight to quality, carry and the aggresiveness of our central bank verses other central banks. But, of the asset classes, the Dollars relationship to the business cycle is the least consistent.
Rates clearly led this cycle lower and it is likely that they will lead the next cycle higher. It is important to note that short rates have risen more than long rates. This has created the type of highly reliable yield curve inversion that signals a coming recession. I believe that the inversion represents a "get ready" warning. A rapid reversal in which short rates fall more quickly than long rates, will be the signal that the reccession is beginning. Once the reccession matures, falling rates, will eventually result in better equities, higher commodities, and an improving business' cycle. Rapidly falling rates should be viewed as a signal that the worst of equity declines is likely in the past.
Equities typically trough before the low point of the economic cycle. As the recession matures, technical lows in equity charts should offer important macro entry points.
As the flight to quality that occurred in 2022 runs its course and the economic cycle becomes more normal the DX will begin influencing commodities again. The Dollar and commodities TEND to trend in opposite directions but the Dollars relationship to other asset classes and the cycle is highly variable.
Eventually markets will realize that the new macro backdrop is one of persistent inflation rather than persistent deflation. Central banks will be more focused on fighting inflation and liquidity, except during episodes of explicit systemic risk, will be far more constrained. As a result, the rates/commodity/equity link will become strong again. Generally speaking, more frequent periods of higher inflation will result in higher yields, a slowing economy, lower commodities, lower earnings and lower equities.
A note on the bond — equity relationship:
The relationship changes over time depending upon the market’s preoccupation with inflation or deflation. Prior to 1997 a fall in yields was bullish for equity as yields were declining in reaction to a falling inflation rate. After the inflation of the 70s, bonds and equity entered simultaneous bull markets as the deflationary forces generated by globalization and technological advance allowed Central banks to become more accommodative without fear of igniting inflaiton. In a deflationary environment, bonds rise when equities fall and act as a hedge to equities. In an inflationary environment both stock and bond prices eventually decline. I suspect that the inflation regime has changed.
Conclusion: 1) The business cycle is likely to weaken significantly over coming months. 2) A rapid decline in rates accompanied by a sharply steeper curve, will likely mark the actual beginning of the recession. 3) The recession itself should produce an excellent entry macro entry point for equity. 4) Man plans, god laughs. 5) Happy New Year to all!
And finally, many of the topics and techniques discussed in this post are part of the CMT Associations Chartered Market Technician’s curriculum.
Good Trading:
Stewart Taylor, CMT
Chartered Market Technician
Taylor Financial Communications
Shared content and posted charts are intended to be used for informational and educational purposes only. The CMT Association does not offer, and this information shall not be understood or construed as, financial advice or investment recommendations. The information provided is not a substitute for advice from an investment professional. The CMT Association does not accept liability for any financial loss or damage our audience may incur.
