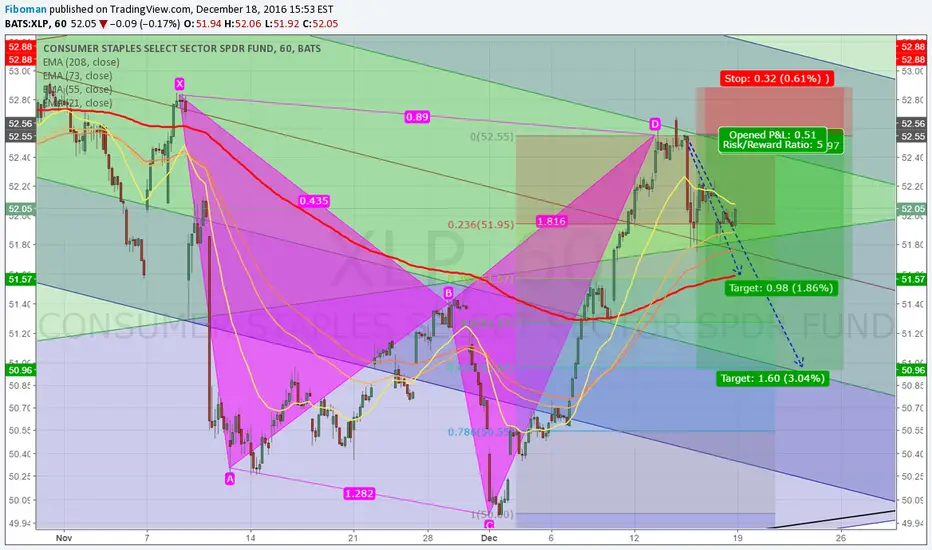
More demand for XLPXLP on the 15-minute chart rallied out of its base. If prices reaches the demand zone between 56.04 and 55.97, I'd want to be a buyer.
XLP trade ideas


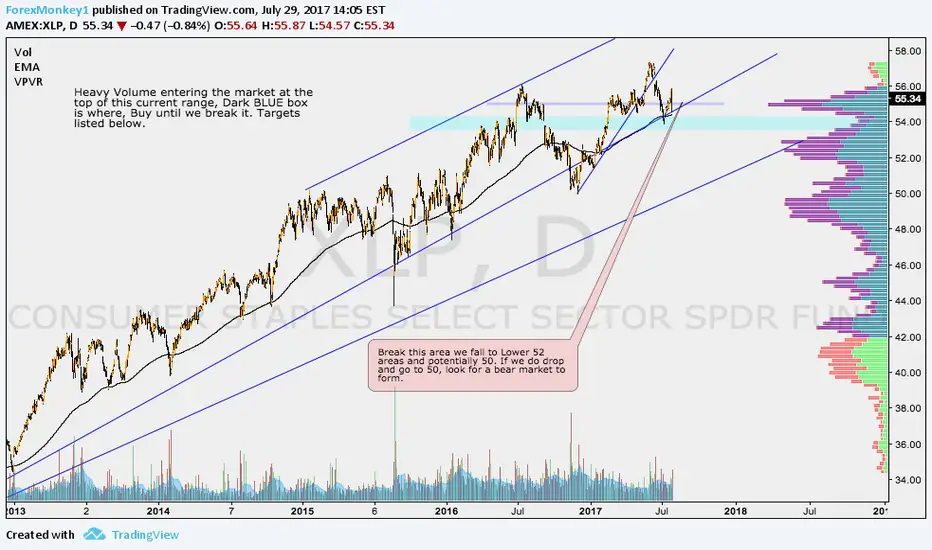
XLP KEY AREA IN PRICE PROVIDED, READ CHART FOR MORE INFO. XLP READ COMMENTS ON CHART FOR MORE INFO. Heavy Volume entering the market at the top of this current range, Dark BLUE box is where, Buy until we break it. Targets listed below.
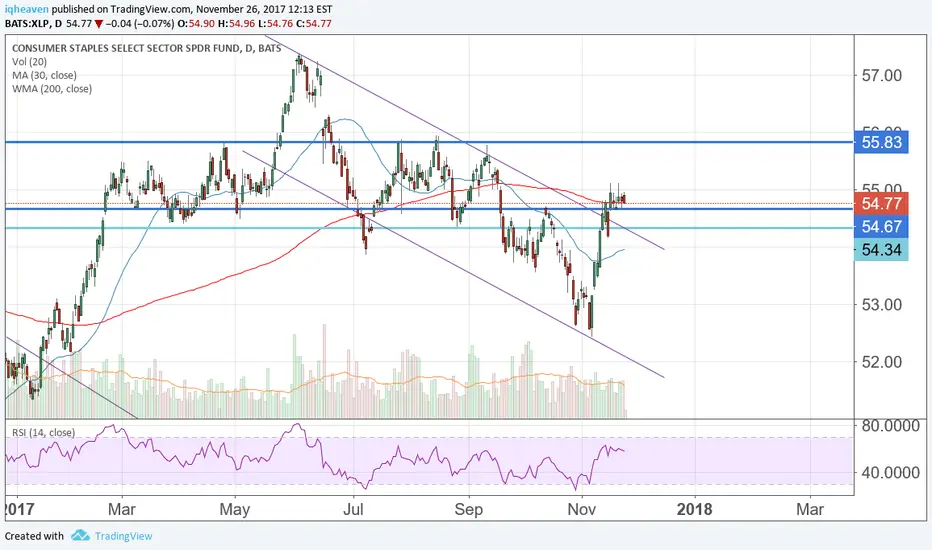
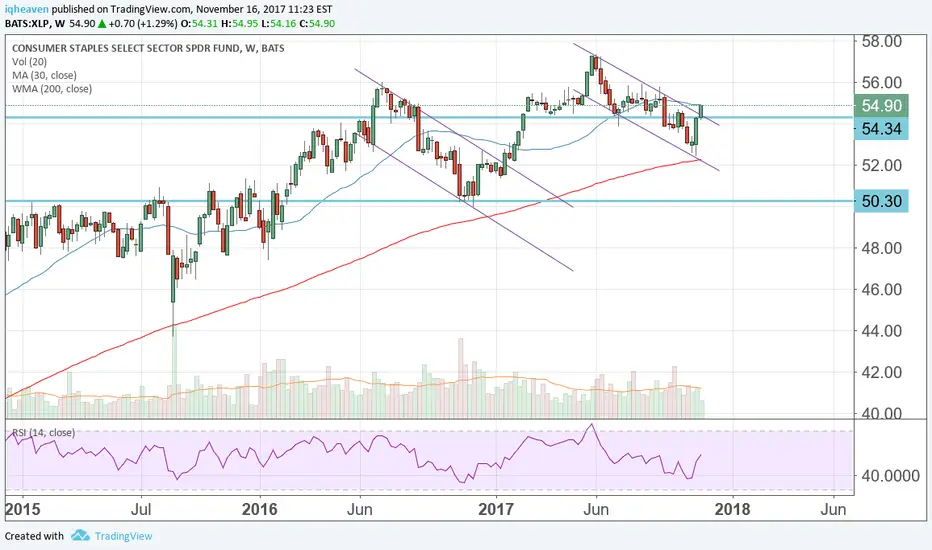
$xlp further short term breakdownhigher time frame is showing defined uptrend with an over-extension on breakout pulling back
mid time frame is showing markup to distribution to consolidation for the next leg down
descending triangle is forming against downtrend line and multiple test of support is showing weakness
possible breakdown to breakout level of 55.7x on higher time frame- first level 56.2x
lower time frame is showing range bound action with sellers slightly in control
descending triangle is also forming- worth monitoring price action

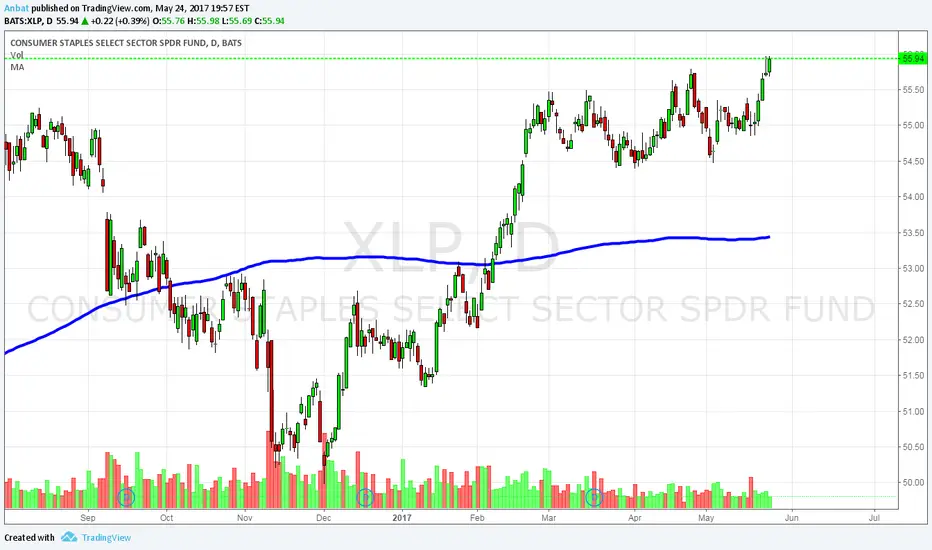
How much will overbought Consumer Non-Cyclical Sector Fall? XLPThe Consumer Non-Cyclical Sector SPDR Fund has been in a bull trend since the end of the financial crisis. An internal and stronger bull trend has taken shape since shortly after the US elections in November 2016. However, this fund is currently near its long-term resistance point which will most likely lead to one of two future moves. The fund could break above this long-term resistance and continue strong gains, or it could reverse course and at the very least return to its support established since the election. Below I have laid out the reasons and levels to which the fund may dip while it continues its overall bull trend.
When we take a look at technical indicators, the relative strength index (RSI) is at 80.8116. RSI tends to determine trends, overbought and oversold levels as well as likelihood of price swings. I personally use anything above 75 as overbought and anything under 25 as oversold. Currently the RSI is overbought. The fund could rise over the next few days or begin its descent now. I will provide further analysis below when this indicator aligns at maximums with two of the other technical indicators.
The true strength index (TSI) is currently 21.5180. The TSI determines overbought/oversold levels and/or current trend. I solely use this as an indicator of trend as overbought and oversold levels vary. The TSI is double smoothed in its calculation and is a great indicator of upward and downward movement. The TSI is moving up.
The positive vortex indicator (VI) is at 1.3859 and the negative is at 0.5248. When the positive level is higher than 1 and higher than the negative indicator, the overall price action is moving upward. When the negative level is higher than 1 and higher than the positive indicator, the overall price action is moving downward. These indicators are at extreme levels indicating a pending reversal of the fund is imminent. I will provide further analysis below when this indicator aligns at maximums with two of the other technical indicators.
The stochastic oscillator K value is 97.0441 and D value is 94.0369. This is a cyclical oscillator that is highly accurate and can be used to identify overbought/oversold levels as well as pending reversals and short-term activity. I personally use anything above 80 as overbought and below 20 as oversold. When the K value is higher than the D value, the stock is trending up. When the D value is higher that the K value the stock is trending down. The stochastic is currently well overbought, but the D value has not overtaken the K value, meaning the fund could produce gains for one or two more days at the most before ultimately turning downward. I will provide further analysis below when this indicator aligns at maximums with two of the other technical indicators.
On three occasions since September 2013, the RSI, positive VI, and stochastic have been at similarly extreme levels at the same time. All three occasions led to drops for the fund. In September 2013 the fund dropped 5.25% in 13 trading days. In October 2013 the fund lost 2.91% over the next 35 trading days. Eventually the fund dropped more than 7% from the October RSI peak (the bottom occurred at the end of January 2014). The smallest decline was seen in February of this year when the fund declined 1.63% over 22 trading days. A natural decline will occur in our current instance, the main question is how much?
Considering the RSI, TSI, VI and stochastic levels, the overall direction favors a move to the downside. Based on historical movement compared to current levels and the current position, the fund could drop at least 1.63% over the next 25 trading days if not

XLP- Conservative Investor?Fund Strategy
The Fund seeks to provide investors with low-cost "passive" approach for investing in a portfolio of equity securities of firms as represented by the Consumer Staples Select Sector Index.
If you look on Weekly and Monthly charts, at an all time high now & gives out around 0.30 cents per share dividend, which should be in June soon. Just might be great to be in your retirement and/or 403 b or....., please look further into this, if it fits your strategy. *At this time, on tradeking.com it says in options summary area, it says: Call open interest (1d) is 79,797 & Put open interest (1d) is 388,065. What does that mean? Most options beating on bearish here.
Iron condor on XLPWith volatility this low I am looking for trades with IV percentile in the last 6months of above 25. XLP have an IV Rank of 14.5 which is low, but IV percentile of 33.5 in the last 6 months (which would meet with my criteria). I am placing an skewed Iron Condor, betting that it will stay within the expected move with a little skewed to the downside thinking that it might want to attack the 200 EMA. I did a ratio of 3 calls spreads for every 2 put spreads.
The trade:
56/58 (2xCall spread) 54/51 (3xPut spread)
51% POP
1.61 credit per contract.
Our break evens are at 53.22 and 56.51
Target is 50% of credit received.

Squeeze playthe KC dropped below the BB line, and the squeeze is now in the red, looking for a sharp drop here. I placed 57DTE bear call spread risking 2 to make 1. I noticed this same pattern developing on the financial earlier this week (XLF), but hesitated and really wish I hadn't. So now its consumer staples turn.
The yellow box indicates profit zone for the options

US sectors – just some thoughtsIt was a very impressive week for XLP – actually it’s 3rd impressive week in a row. What is XLP? Milk, bread, salt, cigarettes. Just when do we usually have a higher demand for this? Anticipating the tough times to come.
I monitor XLP and its correlations with other ETFs to get a bigger picture and – probably - some real advance signs of what to expect. This winning streak might mean to at least watch the market even more closely – in any case it’s gonna be easier to trade some strong moves if you prepared.
A little less impressive picture –but still - in another defensive sector XLU.

Money love silenceThe situations when the broad market and defensive sectors move in the same direction are quite rare - on normal market :-). The reason - participants reshufflle their money. We're now experiencing this unusual situation. Looks like this money just do not want to wait for correction and started to hedge beforehand.
Almost same chart we ahve now in XLU

XLP Counter Trend Rally Counts as Complete This is an update to the XLP post of four days ago 1/17/17.
XLP has reached the lower area of the resistance target zone.
Wave "C" has moved above the termination point of wave "A" and has a clear five wave sub division.
There is a high probability this ETF will begin a new decline on 1/23/17.
This ETF is lagging the broader stock market by a wide margin.
If XLP goes into a new decline the broader market will probably follow.
Mark

Watch XLP January 18 to 20One of the very many factors that indicate the broader US stock market could be at a significant top is the SPX sector ETF - XLP. This ETF is Consumer Staples one of the nine SPX main sectors.
XLP represents the bluest of blue chip stocks and usually the very last stocks to make a top in a bull market. This sector has been lagging the broader market for months, a very bearish sign.
XLP also has a very clear five waves down , followed by what appears to be a three wave correction under construction. The supposed wave "C" up could be complete in the next one to three trading days, January 18 - 20.
Watch XLP, if it tops in the price zone this week it could signal the beginning of a very sharp and deep decline of the broader US stock market.
Mark

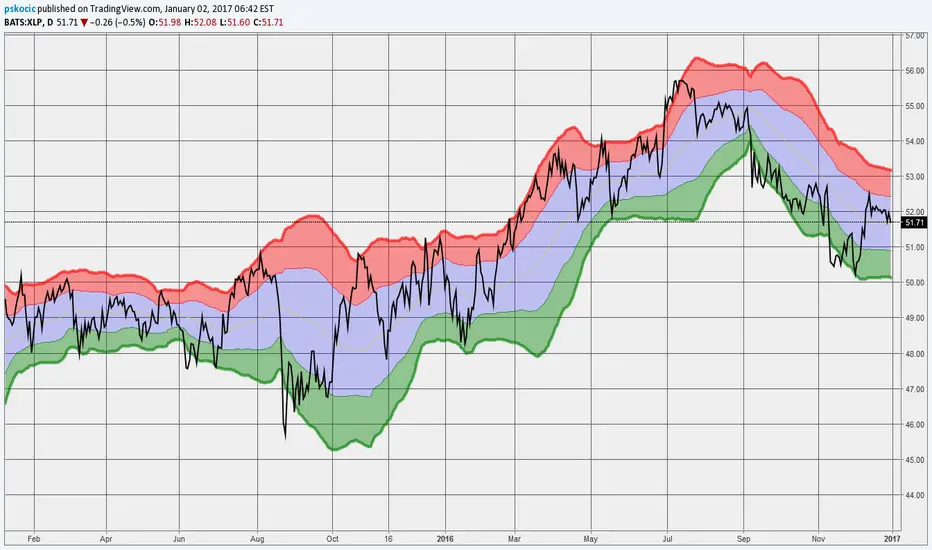


XLP - Heading Down To CenterlineIf the last highs to the left wont hold, price will meet the centerline.
From there, a reversal is very possible.
Interestingly the neon-blue ray points to the CL too (kinda Wolfe-Wave thing).
Hunting for a long.
P!

