XLP Skew - Bullish SentimentXLP Skew - Bullish Sentiment
XLPSubmit 52.31-0.02 (0.0%)SPDR Consumer Staples Select
Traders are willing to offer downside puts at more attractive levels relative to upside calls. The implied volatility of the downside puts is trading at a +32.7% premium to upside calls compared to the 52 week average of +36.7%. This indicates traders are feeling a move to upside or volatility to the upside is increasing demanding less premium to sell puts vs calls. After looking at the options chain marketchameleon.com and not seeing anything in the options to do, I think I may buy the ETF that yields 1.8% and has a good history of making and raising the dividend. marketchameleon.com
XLP trade ideas

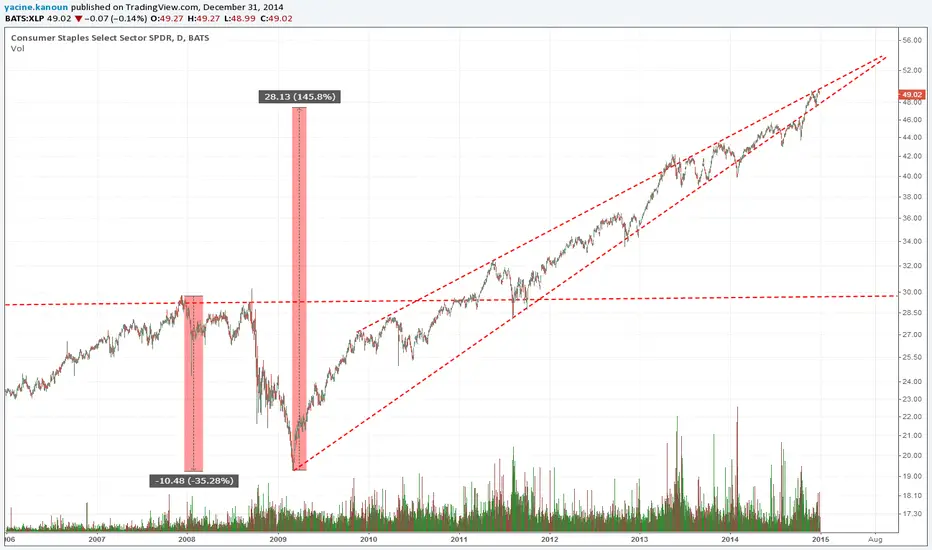
XLP - weekly at trendline, watch weakness.Surprisingly, during the rise in 2016 in the general market, defensive sectors like Utilities and Consumer staples were bid up, in search of yield and dividends. If the Treasury Yield goes UP, or any rate hike actually happens, some funds and big investors will move out of stocks ( even defensive ones such as XLP or XLU ).
Watch major support ( weekly ) around 52.00 USD.


XLP is posed to underperform in 2016this a sector view
im dividing XLP to SPY and I get a ratio chart, showing if a sector is outperforming or down performing.
I think 2016 we will see onr of the leaders (XLP) becoming an underperformer.

Risk Off - are we looking at the market top?This is the ratio chart between XLP to SPY. XLP is the Consumer Staples. It looks like money is going to safer consumer stocks.

Gap needs filled Ide imagine we see a gap fill after it gains support a red line , maybe forms a light volumed right shoulder. Cant wait to see!!!!

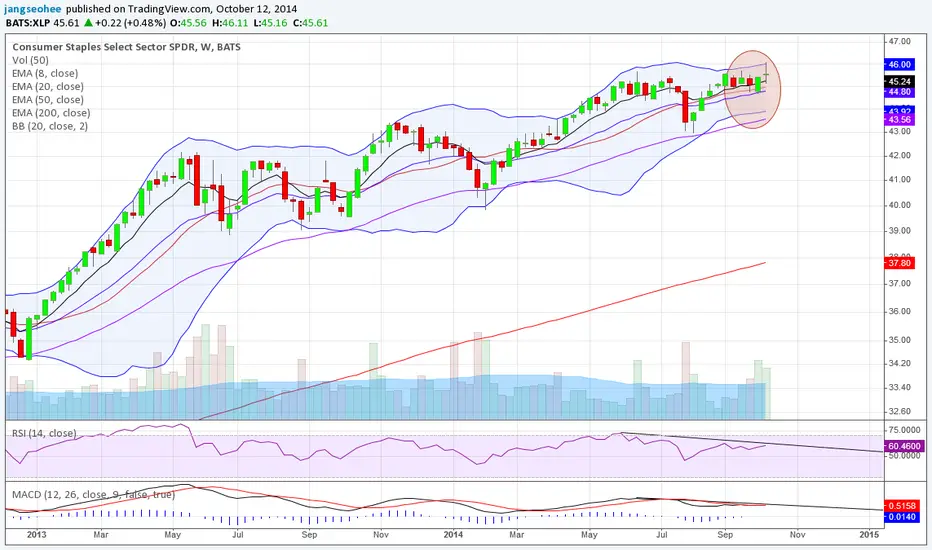
MACRO VIEW: XLP IN FIRM MACRO UPTRENDConsumer Staples SPDR ETF is looking good on both short term and long term basis.
On long term basis - XLP trades in both 5 and 10 year uptrend, as the price stands firmly above 1st upper standard deviations from both 5 and 10 year means It has tested its 5-year trend during the august selloff and held it successfully.
On short term basis - XLP shows no trends in particular, as the price is firmly within the 1st standard deviations from 1-year and quarterly means. It is a positive development, since nothing on short term basis stands in the way of long term trends.

Even Selling Pressure - INDEX and SectorMarks its extreme Oversold Levels. Will wait for triggers.
There are some fat premium stocks that can be good for spread selling.
As far as indices, Premium selling is not bad idea, essentially this would be a directional trade. Consider RTM (Reversion to the mean) i.e., The Momo Oscillator goes back to its mean.
This is an indicator that someone will pack it and sell eventually. Watch out.

XLP - Consumer Staples
This is supposed to be a defensive sector - well done.
The structure of this impressive rally for a sector that was historically boring is showing signs of possible completion....
XLP can't be that far from a decent correction or at least multi month flat trading.
Rates very low for long is probably the explanation... there is a limit to how far that can justify more progress.
Trading: Short 20% at 49 stop 55 (large enough, to avoid managing crystallization but would reconvene if something different occurs)
Back to Maslow's Most Basic NeedMaslow's hierarchy of needs are categorized into five levels, Physiological needs, Safety needs, Love and belonging, Esteem & Self-actualization.
From the above chart, XLP/XLY = the ratio of Consumer Staples/Consumer Discretionary, we can see that when the market is souring(simultaneously ratio is getting bigger), human being tends to have preference towards basic foods, drinks, houses & etc for security which coincide with Maslow's most important physiological needs which corresponds to XLP/XLY ratio hitting as high as 1.2-1.35
Conversely, when market is doing very well, XLY stocks are much preferred causing the ratio to be as low as 0.65
The last two max ratio was in 2001 and 2008. my projection for next max ratio is around 2017.
Though 2008 economic crisis was considered one of the worst, but the lowest XLP/XLY ratio is 0.65 while the lowest current ratio is 0.63. We were even more complacent recently :-), As a consequence, i project that the next market bottom will see this ratio hitting as high as 1.4-1.5, no?
After showing a monthly bullish divergence, i am seeing the slow uptrend already.
P.S. Base on the ratio, it only means that during market crash, XLP stocks drop lesser compare to XLY stocks.

Sector RotationFor the last week of sell-off, the strongest sector would be this Consumer Staples where stocks like KO, PEP, PG, MO, CVS, WMT has a broke up on daily chart.
Bollinger band showing a squeeze, meaning expansion upside/downside is going to take place.
But RSI and MACD are showing me a bearish divergence.
It finished the week with a DOJI and the upper Bollinger band was rejected.
I am skewed towards bear side, though slight chance of upside is not rule out.
Long XLP, Short XLYLong Consumer Staples, Short Consumer Discretionary
A defensive pair for major market correction at historical low level.
The pair is breaking out from a four months correction.
Expecting it to run back to 0.7, indirectly hinting for a potential S&P correction is coming.