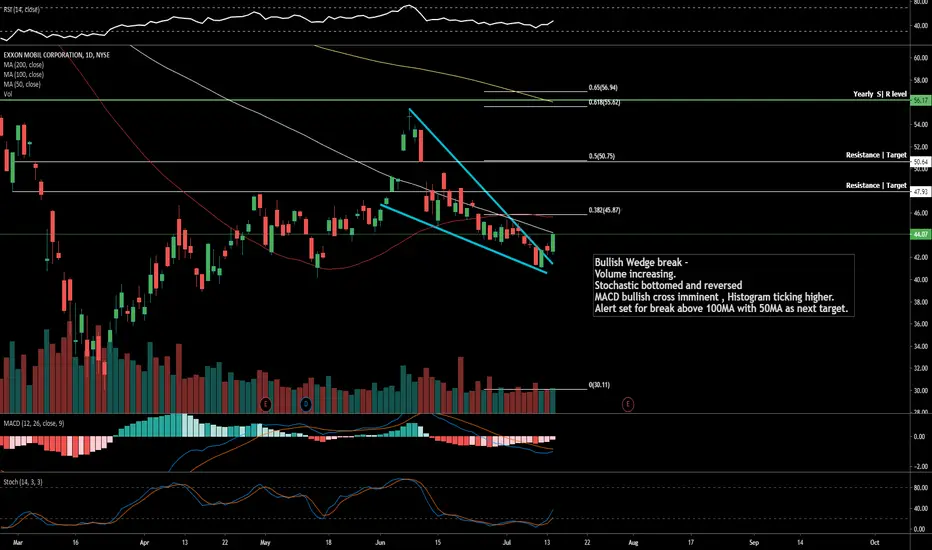
$XOM Exxon Mobile On Breakout Alert
Bullish Wedge break -
Volume increasing.
Stochastic bottomed and reversed
MACD bullish cross imminent , Histogram ticking higher.
Alert set for break above 100MA with 50MA as next target.
PLEASE GIVE US A LIKE IF YOU FIND OUR CONTENT HELPFUL, THANK YOU.
XOM trade ideas
XOM 4HR Setup Possible Squeeze The 4HR 200SMA is looking interesting as it's squeezing in on the price. Watching for a possible bullish retrace back near the .382 fibonacci re-tracement level around $45.45


Energy holding on cloud supportLooking for a bounce back up to 50 levels, XLE is a good all around ETF as well.
Trading on cloud support last few days, I am in only for a relief rally then out.
Coincides with a 50% retracement not shown bc messy charts don't make you look cool guys.

HEY XOMIT'S VERY PROBABLY THAT NYSE:XOM , CAUSE OF A DISCOVERY OF A NEW OIL FIELD , GO UP IN NEXT DAYS

EXXON MOBIL DAILY ANALYSISHi friends
the daily chart of this market shows with a very high probability that it will experience a downtrend until the level of with the vigilance that this market changes the direction towards the opposite direction
please subscribe to receive new analyzes

Weekly Update SoloMoneyTradesOne stock I am watching,
One stock I am buying,
One stock I am shorting
To start it off the stocks I am watching
I am keeping a close on Exxon mobil.
This is a stock that is ready to move with the market, but much more than the market.
I am prepared to short XOM if it drops to 42.00
This stock lost nearly 2x the market during the main loss at 56 percent
So in summary long at 50 dollars short at 42.00
On to the stock I am buying
FSLY or fastly
I showed this in a little bit more depth in another idea, but basically it has broken 52 week high once and is trying to do so again.
I have been impressed with their performance as of March 13th which since then
has been up over 500 percent and the last month has been up 100 percent.
Buy it up anywhere from right now to 90 to 95 dollars
Stop loss anywhere from 82 to 72 dollars
And finally the stock I am shorting
HTZ is a car rental company but has been struggling since 2018, but had an 80 percent decline during the market failure.
It issued more stock on June 8th which some people bought that day and then sold the next 5 days, this stock has gone almost back to where it was before it issued more stock.
Short the stock at 1.40 and take profit at 1 dollar
Good luck MoneyTradingCrew


Short/ Long opportunity here I believe, Exxon Mobil will move in one way very sharply. Which way, you might ask, well hopefully Monday will tell us.
If the price stays above the support zone, then considering a buy is a wise idea. In the other case, we might test some lower levels like 40.13.

Breakout playExxon Mobil is no longer down-trending.
Yesterday, it broke out with a high volume and tested back.
You can also spot a "Regular Divergence" on the MACD indicator, which indicates a trend reversal.
It was also oversold on RSI.
My first price target: 47,25, the second one is 49,47
Set a stop loss around 42,22 in case of dipping more.

Tasty investment opportunity! Exxon Mobil shares buy signalsExxon Mobil, monthly chart: 38 years long(!) support line + Inside Bar & Dragonfly Doji + Oversold


XOM compresion diariaSigue en la TL bajista iniciada el 9/6, precio oscilando entre los 2 retro Fibo de 0,382 y 0,50 (46,16 - 43,35).

Elliott Wave View: Exxon Mobil Pulling BackElliott Wave View in Exxon (ticker: XOM) shows that the stock has an incomplete bearish sequence against June 8 high. The decline from June 8 high unfolded as a zigzag Elliott Wave structure, where wave (A) ended at 44.75 low. Afterwards, the bounce in wave (B) ended at 49.8 as a zig-zag Elliott Wave Structure in lesser degree. The bounce reached the 100% extension in 3 swing at the blue box area. Up from wave (A) low, wave A ended at 47.76 high and wave B pullback ended at 47.14 low. The stock then extended higher in wave C, which ended at 49.80 high. Exxon then turned lower from the blue box area. The decline has broken below wave (A) low, confirming next leg lower in wave (C) is already in progress.
Down from wave (B) high, wave 1 ended at 45.40 low. The internal subdivision of wave 1 unfolded as 5 waves impulse. Wave ((i)) ended at 47.24 low and bounce in wave ((ii)) ended at 48.75 high. The stock then resumed lower in wave ((iii)) towards 45.77 low and wave ((iv)) bounce ended at 48.20 high. Final leg wave ((v)) ended at 45.98 low, which completed wave 1. Pair then bounced in wave 2 and ended at 47.35 high. Currently, wave 3 is in progress, where wave ((i)) ended at 46.65 low and wave ((ii)) bounce ended at 47.22 high. Wave ((iii)) has resumed lower and near term, while below 49.80 high, expect bounce in 3,7, or 11 swing to fail and Exxon to extend lower again.

XOM 7/17 $45c XOM 7/17 $45c
1. McGinley Dynamic acting as historical support (see: 04/02, 04/16, 05/14, 06/22 daily candles)
2. StochRSI in buy zone
3. Bounce off 0.618 Fib Level likely ($45.60)
3. XLE Energy Sector ETF is trending up
4. Crude prices increasing as demand for oil recovers

Exxon Mobil Corp (XOM - NYSE) - Updated EW count Exxon Mobil Corp (XOM - NYSE) has completed WXY pattern from bottom as indicated in chart. It dropped in impulse as wave A and correcting up in wave B, which might take 2-3 days to complete. Thereafter C wave will resume the fall in price action.

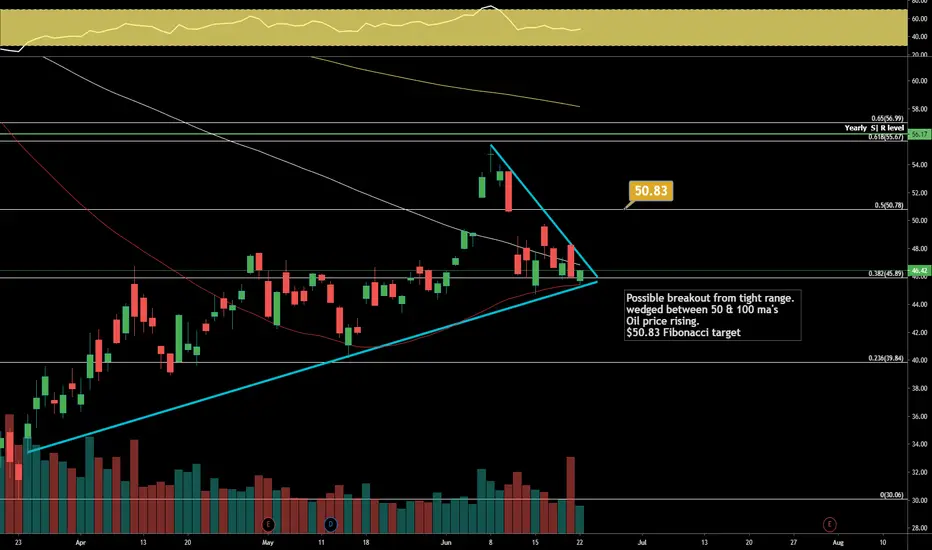
$XOM EXXON Mobile Breakout Target
Possible breakout from tight range.
wedged between 50 & 100 ma's
Oil price rising.
$50.83 Fibonacci target
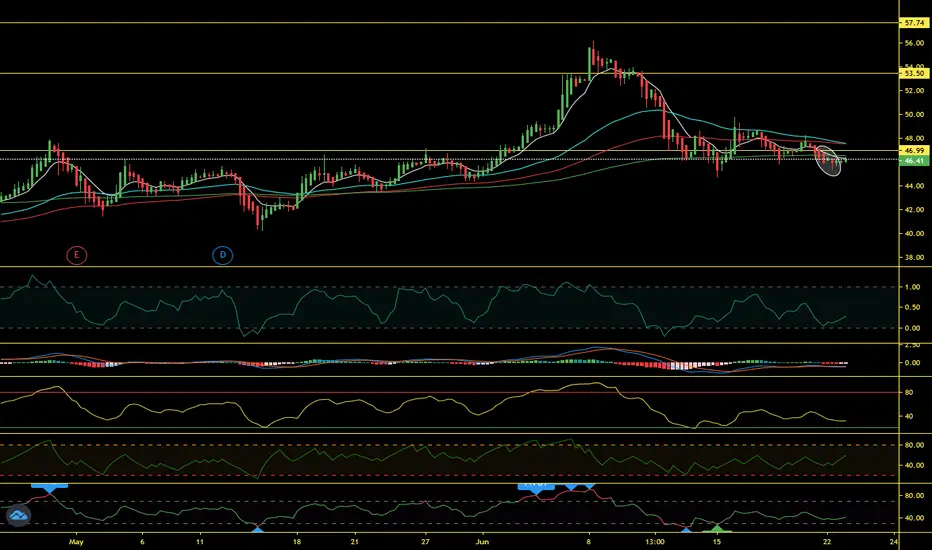
XOM Analysis (1Hr Chart)Daily
- Bullish Channel
- Break of Decreasing Daily Volume w/ A 2.5x Volume Candle on Friday June 19th
- Increased Volume Candle Could be a Reversal Point
1Hr
- Island Top Reversal into a Symmetrical Triangle
- Bearish Momentum, but Again Looking for a Reversal from Big Volume Candle on Friday
Prediction
- A Reversal to Begin and Break Out of the Symmetrical Triangle w/ A Tight Stop Loss and Strong Potential Upside
- 1st Price Target: 54.98
- 2nd Price Target: 61.90


XOM Long but not for longNYSE:XOM
The post Corona-Crash regression is approaching the downward dip trend of past year. The intersection will coincide with the earnings so at the earnings we could see a break downwards.
But until then we might see 1 or 2 tests of the 54.20 resistance. Depending on market conditions. 54.20 was also the max of the dead cat bounce during the crash and is also close to the level of the shoulder of the last peak of Jun 20.
(this is merely a guess, it is not financial advice, etc...)

