XOM trade ideas

Good Entry Time For EXXON???As you can see in the chart above, EXXON is hovering around strong support... I don't see it breaking this support line anytime soon. If it follows its own history, look for a bounce off the support and a climb towards higher ground. Furthermore, its moving average shows oversold conditions.

Colossal Head and Shoulders Top in Non-renewable Energy LeaderExxon Mobile is exhibiting a massive H&S top and is now trying to break below the neckline for the second time. Often times if a support/resistance break attempt fails, the second attempt tends to be more successful. If this Head and Shoulders top does break down, that should coincide with the price of Oil and be the start a new bear market for the non-renewable energy sector (which would be a sign of strength for renewable and electrical energy in the years to come).

XOM Disappoints AgainDespite rising gasoline prices at the pumps, Exxon Mobil did not have a strong Earnings Report. The stock remains in a downtrend, with support at a previous technical low.


Exxon Mobile Buy SignalThe Megalodon indicators are showing us buy signals on Exxon Mobile! The daily is also looking like if it holds these levels, it will be a strong support level to see an upwards increase in the coming days! Not a bad time to start nibbling on XOM.
Click the link in my bio and try out the megalodon indicators today!
Daily XOM stock price forecast analysis18-Jul
Price trend forecast timing analysis based on pretiming algorithm of Supply-Demand(S&D) strength.
Investing position: In Falling section of high risk & low profit
S&D strength Trend: About to begin a rebounding trend as a downward trend gradually gives way to slowdown in falling and rises fluctuations
Today's S&D strength Flow: Supply-Demand strength has changed to a strengthening selling flow when stock market opening.
read more: www.pretiming.com
Forecast D+1 Candlestick Color : RED Candlestick
%D+1 Range forecast: 0.6% (HIGH) ~ -0.6% (LOW), 0.0% (CLOSE)
%AVG in case of rising: 1.0% (HIGH) ~ -0.5% (LOW), 0.5% (CLOSE)
%AVG in case of falling: 0.3% (HIGH) ~ -1.2% (LOW), -0.8% (CLOSE)

Daily XOM stock forecast trend analysis 10-JUL
Price trend forecast timing analysis based on pretiming algorithm of Supply-Demand(S&D) strength.
Investing position: In Rising section of high profit & low risk
S&D strength Trend: In the midst of an upward trend of strong upward momentum price flow marked by the temporary falls and strong rises.
Today's S&D strength Flow: Supply-Demand strength has changed from a weak buying flow to a strengthening buying flow again.
read more: www.pretiming.com
D+1 Candlestick Color forecast: GREEN Candlestick
%D+1 Range forecast: 0.9% (HIGH) ~ 0.1% (LOW), 0.6% (CLOSE)
%AVG in case of rising: 1.1% (HIGH) ~ -0.3% (LOW), 0.9% (CLOSE)
%AVG in case of falling: 0.4% (HIGH) ~ -0.9% (LOW), -0.4% (CLOSE)

Giant H&S in energyClassical chart patterns are not my strongest skill. However, seeing this H&S make me say mentally 'uh-oh'. My experience with H&S is that once the structure is completed price action gets brutal.
A similar thing is observed in OXY. CVX does not display H&S but demonstrates a lot of bearish bars (pins, engulfing) on M and 2M timeframe. XOM is challenging 200MA on M chart for the first time ever.
This post is not a trade rather than a piece of context for future short trades in energy.


XOM stock price forecast timing analysis02-Jul NYSE:XOM
Price trend forecast timing analysis based on pretiming algorithm of Supply-Demand(S&D) strength.
Investing position: In Falling section of high risk & low profit
S&D strength Trend: In the midst of a downward trend of strong downward momentum price flow marked by temporary rises and strong falls.
Today's S&D strength Flow: Supply-Demand strength has changed from a weak selling flow to a strengthening selling flow again.
read more: www.pretiming.com
D+1 Candlestick Color forecast: RED Candlestick
%D+1 Range forecast: 0.3% (HIGH) ~ -0.1% (LOW), 0.0% (CLOSE)
%AVG in case of rising: 1.1% (HIGH) ~ -0.4% (LOW), 0.6% (CLOSE)
%AVG in case of falling: 0.3% (HIGH) ~ -1.2% (LOW), -0.9% (CLOSE)

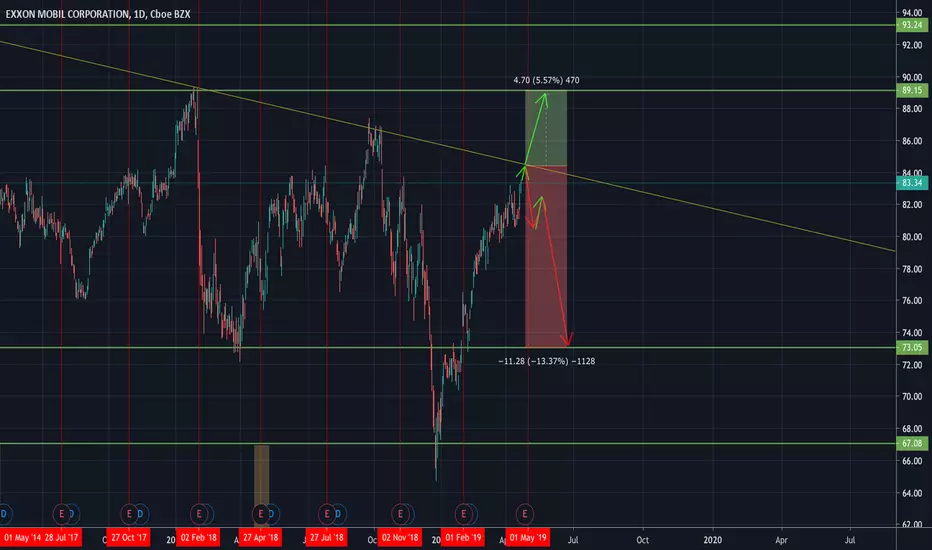
XOM Potential Movement in next 3 monthsWatching daily price action and 4hr trend analysis. Potential breakout in the near future.
NOT SURE which direction it will go, but keep watching to set up for long($88) or short($72) trade.
Not investment or trading advisory. For educational purpose only.


XOM stock price forecast timingStock investing strategies
Read more: www.pretiming.com
Investing position about Supply-Demand(S&D) strength: In Falling section of high risk & low profit
S&D strength Trend Analysis: About to begin a rebounding trend as a downward trend gradually gives way to slowdown in falling and rises fluctuations
Today's S&D strength Flow: Supply-Demand(S&D) strength flow appropriate to the current trend.
D+1 Candlestick Color forecast: RED Candlestick
%D+1 Range forecast: 1.0% (HIGH) ~ 0.1% (LOW), 0.2% (CLOSE)
%AVG in case of rising: 1.1% (HIGH) ~ -0.4%(LOW), 0.7% (CLOSE)
%AVG in case of falling: 0.2% (HIGH) ~ -1.2%(LOW), -0.9%(CLOSE)
Stock Price Forecast Timing Criteria: Stock price forecast timing is analyzed based on pretiming algorithm of Supply-Demand(S&D) strength.

Kill the CancerExxon conned and scammed the public of early action on climate change, a genius business move, but a sold soul. waiting until september to short the company to $1 unless they announce a total 180 to entirely renewable tech which would be a lol. Invest and bet on the future you envision or believe to see. Fk exxon.

Exxon (XOM)This stock has an high dividend yeld of 4.73% and regualr growth in the payout. Oil prices in recent years have been capped by the flood of production from shale reservoirs.
Total debt: 40 Bil.
Total annual profit: 20 Bil. (2018)


Exxon Mobile (XOM) Trend Analysis: Bearish SentimentI am predicting that Exxon Mobile will have further bearish movement, due to a few sequential chart patterns appearing. First, the death cross. At this point, the 65 period EMA closed below the 200 period moving average, an extremely strong sign of negative movement. The confirmed resulting downtrend resulted in a period of consolidation. When price action leads to consolidation for an extended period of time, it usually leads to a large breakout, highly indicative of the overall price movements for a given period of time. XOM consolidated and broke out downwards, beginning to correct itself. A quick correction with high volume formed a resistance level. If all holds, XOM has more volatility and downtrending in its future before it has a reversal.

Chart of the Day: XOM weekly chart continues downward spiralSince 2016, XOM has been trading off 78.6% lower highs with MACD cross-downs followed by an ABCD completion. No reason to think this time would be any different considering the company has a fair bit of debt, production volumes has not been all that great and recent investments in US shale may not be as rosy as previously thought.
The target for this weekly CD leg is c.$60 which is a long way down.