BNB/BTC 4HOUR UPDATEWelcome to this quick BNB/BTC analysis.
I have tried my best to bring the best possible outcome in this chart.
Reason of trade:- We can see in the chat BNB/BTC bullish flag patterns and broke out the resistance level and retesting it
Entry:- 0.01043,0.01058
Traget:-
T1:- 0.01087
T2:- 0.01110
T3:- 0.01130
Stoploss:- 0.01025
Remember:-This is not a piece of financial advice. All investment made by me is under my own risk and I am held responsible for my own profit and losses. So, do your own research before investing in this trade.
Happy trading.
Sorry for my English it is not my native language.
Do hit the like button if you like it and share your charts in the comments section.
Thank you...
BNBBTC trade ideas

bnbbtcThe ascending line is broken. In this situation, my analysis is that it will reach the second target and it will fall and I will open the short position.

BNBBTC is creating a bullflagBNBBTC is creating a bullflag below the daily resistance.
IF the price is going to have a breakout, According to Plancton's strategy(check our Academy), we can set a nice order
–––––
Follow the Shrimp 🦐
Keep in mind.
🟣 Purple structure -> Monthly structure.
🔴 Red structure -> Weekly structure.
🔵 Blue structure -> Daily structure.
🟡 Yellow structure -> 4h structure.
⚫️ Black structure -> <4h structure.


BNB Update, bullishness holding?When we last looked at BNB-BTC we were contemplating two potential paths (Aqua and Yellow on chart). The bullish Aqua path presumed we might be finishing off a not-so-clean Cup & Handle formation. The bearish Yellow path suggested price might retreat back down towards Range Support. As it looks right now, the Aqua path seems slightly more likely to me--thought it may not keep the same high trajectory. My hesitation is that there may be divergence forming on the Weekly for this pair and that could generate some serious downward pressure. I'm considering a small, high-risk long here.
----------------------------------------------------------------
These are my personal views and not financial advice. Please do your own research before investing.
I'd love to hear your thoughts, ideas and feedback. Feel free to Comment and I'll try and get back to you quickly.
If you appreciated this analysis, consider Liking or Following . Thanks!

BNBBTCHello Crypto Lovers,
Mars Signals team wishes you high profits.
We are in the daily time frame. We had an R1 line which the price broke it. There is also an S1 line which the price hit twice and could not break it but it was broken on the third try. The price has made a pullback to this line too and now is fluctuating above it. You can buy it from here for the R1 line. Or you had better wait for the price to hit the S1 line again and buy there for the R1 line. If the price goes below our S1 line, then it would fall further. If the R1 line is also broken then higher targets will be aimed.
Warning: This is just a suggestion and we do not guarantee profits. We advise you to analyze the chart before opening any positions.
Wish you luck

Bullish Case, Bearish CaseI'm currently Neutral on BNB as there is no obvious entry here for the way I trade. However, I can see reasons to be both bullish and bearish.
Bullish Case:
BNB may be completing the Handle of a C&H pattern. The Cup isn't exactly pristine, but that might just be a casualty of charting against a volatile asset (BTC). Consider a high-risk/high-reward smaller long position here.
Bearish Case:
BNB is ranging and it's recently bounced off the top of the range. Sell pressure *could* push BNB back down to the bottom of the range.
Either way, I'm on the sidelines here until I see a more interesting entry.
Good luck and Happy New Year! :)

BNBBTC Sell setupHi guys !
BNBBTC is setting up for more downside. Look for sell setups or strong breakdown.
Thank you for your support.

INCREASE YOUR #BITCOIN SATOSHIS USING #BINANCE $BNBBased on Gann methods these are the areas for rebounding into the trend


#BNB gonna make a huge move | NEW ATHHello Padawans.
No more long captions for today, I think this chart sense more than 1000 words.
let's see what will happen next.
#NFA
Cheers padawans,
may the force be with you.

$BNB, if its able to bounce above ~0.11 sats$BNB
Not sure whats going on with volume on this pair but if its able to bounce above ~0.11 sats, it may go up for the ATH
#BNB
BNBBTCThere is divergence and i see ending diagonal end of the way 5 of B of triangle, so i think it ca breakdown

Elliott Wave Analysis: BNBBTC Is Looking For Wave (C)Hello Crypto traders!
Today we will talk about BNBBTC pair, in which we see very nice and clean EW pattern.
If we take a look on BNBBTC daily chart, we can clearly see it unfolding a bigger, higher degree (A)-(B)-(C) correction. Currently we can see it trading in final stages of an A-B-C pullback within wave (B) that can be followed by another sell-off within wave (C), similar as in May 2021.
So, if we are on the right path, then Binance coin may see limited gains and could turn down anytime soon, which can send the BNBBTC price down to 0.0065 - 0.0040 support zone before bulls show up again.
Be humble and trade smart!
If you like what we do, then please like and share our idea.
Disclosure: Please be informed that information we provide is NOT a trading recommendation or investment advice. All of our work is for educational purposes only.

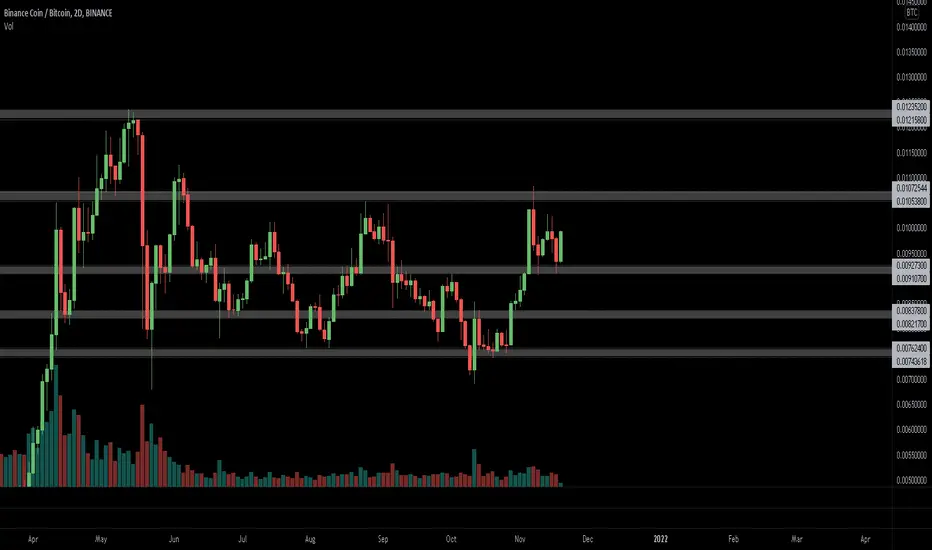
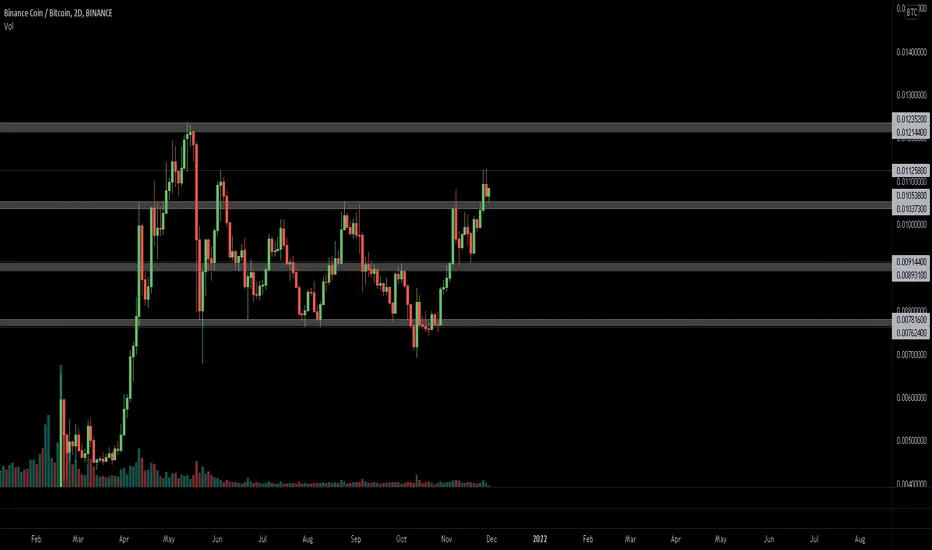
BNB vs BTC Performance - MonthlyBNB has been performing very well against BTC this month, reaching new all time high on November 26th. I expect strong relative performance moving into December should the current trends hold.

I'm trying to learn the skill of trading.The best I can tell, we are breaking up.
I trade other cryptos against BTC, otherwise switch to BTC

Is BNB preparing for another pump?BNB coin is stuck into resistance zone after breaking out from the long falling wedge pattern.
200 D MA is turn into support, retested twice and created hidden bullish divergence + double bottom formation.
Now we are again in resistance zone trying to breakout and turn it into support.
If BNB manage to clear this area, "last resistance zone" will be tested within week or two.
200 D MA is main support for this breakout try, if we lose it I'm out of this trade.


Long BNBBTCLong BNBBTC
I will entered this trade this morning after a 6h candle close break above the 10000 sat zone.
Entry trigger 6H close above 9999 sat zone
1st target 10700 sat zone
2nd target 11850 sat zone
Invalidation day close below 9520 sat zone

Going long BNBBTC, broke out of triangleLook, it broke out of the triangle and confirmed. I sold some bitcoin for some BNB, not much, some.

$BNB, Double tap at ~0.009 sats area and trying to show strength$BNB
Double tap at ~0.009 sats area and trying to show strength
Aiming for a retest of the local highs (~0.01) and then evaluate if it has enough for continuation toward ATH
#BNB