BNBBTC ShortTime Frame: 4H
Symbol: BNBBTC
Entry: 0.010338
TP: 0.009920
SL: 0.010645
Bias: Short
Today we are on the sell side for this pair. Our bias is short. However, considering the strength of movement we do not see any significant price drive. The signal strength is mediocre.
BNBBTC trade ideas

BNBBTC NeutralTime Frame: 4H
Symbol: BNBBTC
Bias: Neutral
For this instrument our bias is neutral. We do not see any significant up or downside from the current market context . SO we stay neutral to see further what is coming up next.

Binance Coin Cup & HandleWe are having a strong breakout today after BNBBTC found support right above EMA50/EMA100.
This comes after a cup & handle pattern.
This opens the door for additional growth.
Namaste.

BNBBTC D1The live BNB price today is $420.96 USD with a 24-hour trading volume of $1,797,584,829 USD. We update our BNB to USD price in real-time. BNB is up 0.20% in the last 24 hours. The current CoinMarketCap ranking is #4, with a live market cap of $68,732,690,698 USD. It has a circulating supply of 163,276,975 BNB coins and a max. supply of 165,116,760 BNB coins.
If you would like to know where to buy BNB at the current rate, the top cryptocurrency exchanges for trading in BNB stock are currently Binance, CoinTiger, Bybit, FTX, and Bitget. You can find others listed on our crypto exchanges

BTC/CHART/LONG TIMELong-term movement of bitcoin technically and fibo nachi.
You can save and set your own pattern for at least 2 weeks

BNBBTCHello Crypto Lovers,
Mars Signals team wishes you high profits.
We are in the daily time frame. The price has broken the resistance line and is making its pullback. We expect it to rise up again and hit the next resistance zone. If this resistance zone is broken, it will go higher and if the support zone is broken, it will go lower.
Warning: This is just a suggestion and we do not guarantee profits. We advise you to analyze the chart before opening any positions.
Wish you luck

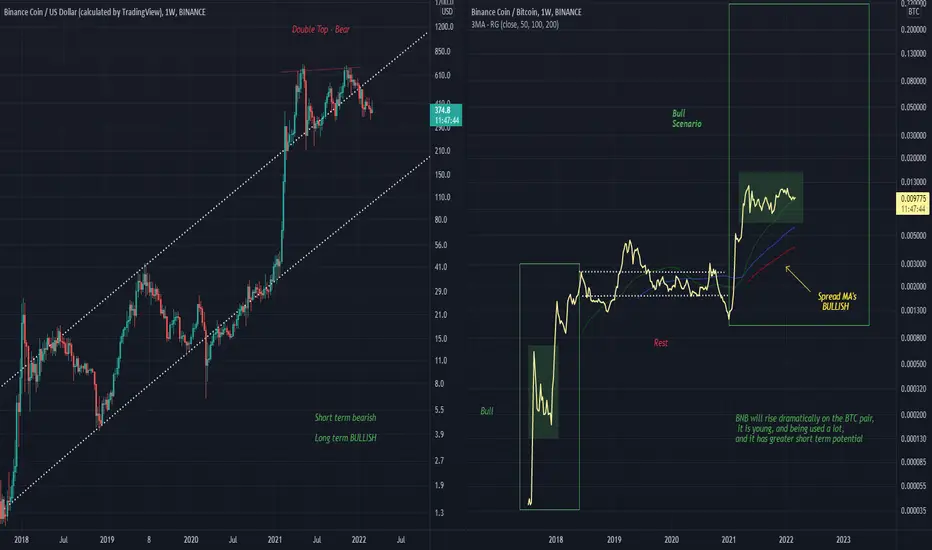
BNB AnalysisOn the USD pair the double top will dominate in the short term, leaving price to fall a bit.
On this dip it would be a great time to enter.
This dip is shown on this analysis below
The BNBBTC pair looks very bullish, you could call the current structure in the bigger rectangle a double top, but if it were an extremely bullish case it could act as a bullflag.
BNB almost reminds me of the early BLX (Bitcoin) chart. Immense bull action with little bear downtime.
💡Don't miss the great buy opportunity in BNBBTC @binance
Trading suggestion:
". There is a possibility of temporary retracement to the suggested support line (0.009386).
. if so, traders can set orders based on Price Action and expect to reach short-term targets."
Technical analysis:
. BNBBTC is in a range bound, and the beginning of an uptrend is expected.
. The price is above the 21-Day WEMA, which acts as a dynamic support.
. The RSI is at 70
Take Profits:
TP1= @ 0.009866
TP2= @ 0.010074
TP3= @ 0.010362
TP4= @ 0.010794
TP5= @ 0.011313
SL= Break below S2
❤️ If you find this helpful and want more FREE forecasts in TradingView
. . . . . Please show your support back,
. . . . . . . . Hit the 👍 LIKE button,
. . . . . . . . . . Drop some feedback below in the comment!
❤️ Your support is very much 🙏 appreciated! ❤️
💎 Want us to help you become a better Forex / Crypto trader ?
Now, It's your turn !
Be sure to leave a comment; let us know how you see this opportunity and forecast.
Trade well, ❤️
ForecastCity English Support Team ❤️

BNB is gonna outperform BTCOn the Weekly chart in BTC pair, BNB seems to have risen after months of consolidation phase carrying out the first upward impulsive move. Its currently almost at the end of its impulse correction wave 2 and is ready to get to new heights in its BTC pair.
Since BTC also looks bullish so the USDT pair of BNB will hopefully perform well in the upcoming weeks.

BNBBTC ShortTime Frame: 4H
Symbol: BNBBTC
Entry: 0.009362
TP: 0.008736
SL: 0.009832
Bias: Short
This instrument is demonstrating a short bias. A strong rejection of upward moves in different verticals of cryptos has created a selling opportunity . This trend may continue with some checks and balances and we must trade any instrument carefully so that we can escape from any hidden liquidity traps.

BNB/BTCI think we have a good volume signal here.
the trend is probably going up.
Let's see what's to come.

BNBBTC ShortTime Frame: 4H
Symbol: BNBBTC
Entry: 0.009586
TP: 0.008970
SL: 0.010032
Bias: Short
For BNBBTC we are going short. As the price structures are trending down considering multimembrane price rate change analysis, our projection is for a short trade. Let us go for a short trade.

BNBBTC ShortTime Frame: 4H
Symbol: BNBBTC
Entry: 0.009551
TP: 0.008885
SL: 0.010031
Bias: Short
For this pair we are planning a short trade. Our RSI divergence and dynamic support and resistances show a possibility for going short . Precaution must be taken before placing any trade.

BNBBTC ShortTime Frame: 4H
Symbol: BNBBTC
Entry: 0.009545
TP: 0.008814
SL: 0.010081
Bias: Short
For BNBBTC we going short. Considering the recent price actions ,candlestick patterns and dynamic support and resistances ,it is evident that the bias is short and therefore we are to go for a sell trade.

BNBBTC LongTime Frame: 4H
Symbol: BNBBTC
Entry: 0.009688
TP: 0.010770
SL: 0.009.36
Bias: Long
The instrument is in a bearish pattern and the price oscillations and volatility study of recent price action and our multi-timeframe study denote a bullish opportunity . We can also detect a recent rsi divergence which is suggestive of a new long opportunity after the necessary trend drawdown.

BNBBTC NeutralTime Frame: 4H
Symbol: BNBBTC
Bias : Neutral
The price structure of this pair is showing sideways and there is not any strong impetus to drive the price significantly up or down. And that is why we are neutral for this pair. Though an study of divergences give us bullish signals, we are not yet confirm or sure about those and that is the reason we must wait before we jump next. Thanks for vising our page.

BNB/BTC Prediction AnalysisGood Morning to all respected Traders and Investors,
I made a simple analysis for BNB/BTC
Here I found the support at 0.01 for entry
I reckon you guys to entry at 0.01 and take profit at my potential target 1, 2 and 3
Patience is the only key
Moreover the vumancu indicator shown green dot, It means time to buy and CCI Indicator shown is not oversold
Do not forget to take profit
Happy trading you all
Critics and comments are super appreciated
Thanks!
PS: This is not financial advice. Please DYOR before entry the market

BNBBTC Long Time Frame: 4H
Symbol: BNBBTC
Entry: 0.009942
T.P: 0.010492
S.L: 0.009600
Bias: Long
Currently the price is at a low point or technically at a support level. Though we do not see any strong evidence of strong volatility to take the prices above the roof, we can still predict a bullish momentum which will take the price to an upper level and therefore we are planning a long trade. Precaution must be taken while trading any rangebound instrument in any situation.

BNBBTC LongTime Frame: 4H
Symbol: BNBBTC
Entry: 0.009994
T.P: 0.010792
S.L: 0.009392
Bias: Long
This is another interesting instrument in the crypto vertical. Currently the price is oscillating at a support level and waiting for a jump up. Given the current context, the probability of getting a profitable trade is obvious. As we see the expected move is imminent . And the move will be strongly supported by the price rejection at support level.

bnbbtc What will happen in bnbbtc pair in h1 timeframe? Maybe waiting is more suitable decision than trading too much.

BNBBTC is a hitStochastic is beautifully going up.
4H MFI is soaring.
It has accumulated all the power to go up.
Trade with caution.

BNB Binance Coin to Lose its 3X Hype Gains. 58% Drop Expected.BINANCE:BNBBTC has gained a lot of attention and hype in March 2021 that contributed to its 3x rise in two months from 4k Satoshi in March to 12k Satoshi in May. The hype was based on Binance entering the DeFi space and announcing its staking returns. At the time, The Binance exchange announced up to 27.49% APY return for staking the BNB token. Currently, the highest APY for BNB according to Binance is 8.69%. Users' interest in gaining annual yield reveals itself to be a delusion to many when they see the gain on capital in the negative 30% territory. Less and less BNB coins are being staked ever the initial announcement in March 2021. There is no more reason to hold BNB. On the other hand, DeFi has also been losing traction as indicated by the price of many DeFi tokens such as AAVE losing 74% of its value vs BTC (even more vs USD). Therefore, it is time for BNB to give back those hype-propelled gains and go back to 4k Satoshi.
The first step is breaking the 10k Satoshi support. We are currently sitting at that line. I have drawn a descending triangle there, but it is not confirmed because it needs a third touch on its upper side. My conservative scenario is that we remain within the triangle for 6 more weeks. My bearish scenario is that, if we don't break the 10k Satoshi support right now, we see a weak bounce up to 10.5k Satoshi before dropping to break 10k Satoshi. The first target is 7.7k Satoshi. Follow me to get updates on this trade as it unfolds.
I am making this bearish prediction on BNB even though I am biased towards BNB because of its impressive performance in the previous Bitcoin bear market in 2018 to 2020. But I would be happy to get a buying opportunity at 4k Satoshi, and I believe we will reach there.
