Will BNB break through the important $600 level?In this idea I marked the important levels for this week and considered a few scenarios of price performance
If the local trend line breaks down, we can expect further correction to the first support zone, also near the 0.382 Fibonacci level
Write a comment with your coins & hit the like button an
Key stats

A plan for BNB trading through the 27thMarked the important levels in this video for this week and considered a few scenarios of price performance
Locally, the price looks bullish. We have already seen a reaction from the level of $600, if the local top is renewed we may see growth to the level of $620
Write a comment with your coins &

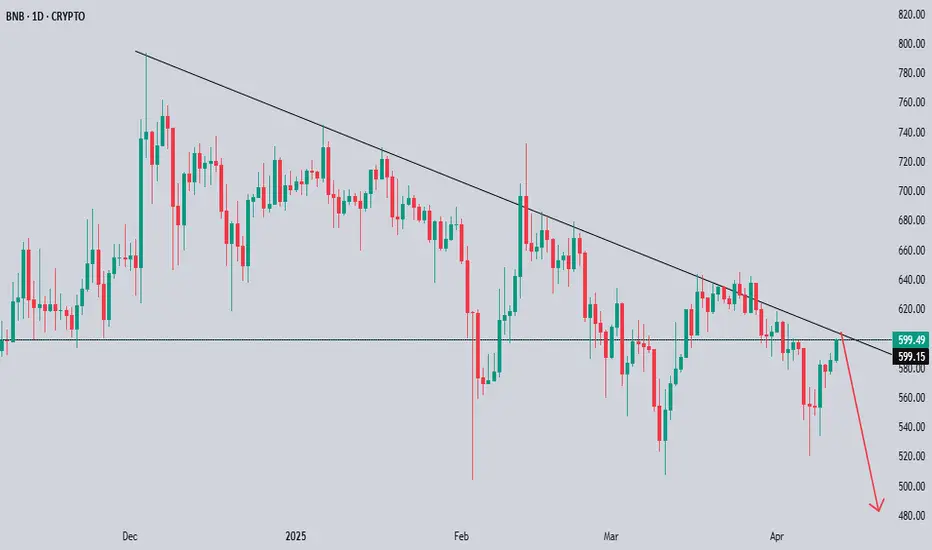
BNBUSD - Double Top ScenarioPlotting a second double top that could push BNB way lower
Bars pattern in red shows this drop
This is the daily chart for BNB
Cautionary chart


BNDUSD Technical and Order Flow AnalysisOur analysis is based on multi-timeframe top-down analysis & fundamental analysis.
Based on our view the price will fall to the monthly level.
DISCLAIMER: This analysis can change anytime without notice and is only for assisting traders in making independent investment decisions. Please note that
Binance – Bearish Momentum Builds as $576.95 Resistance Holds The bearish sentiment surrounding Binance Coin (BNB) may continue to deepen, following the market’s failure to reclaim the critical resistance level at $576.95. After several weeks of consolidation, BNB’s price action is now tilting toward a continuation of the downtrend as sellers regain control.

Clear stop hunt, but Short opportunity here IMO on BNBUSDTWe see (as long as it keeps trending like todays pump is running out of upside) lower lows.
As simple as that really. And I think quick 1% drop without much thought.
Happy to add up to $581 but beyond that, I will let it go and just close my short. Enjoy!

Binance Coin (BNB) Takes a Hit: Bears Aim for Sub-$580 LevelsBinance Coin (BNB) is facing strong selling pressure after failing to maintain momentum above the $616.45 support level. The cryptocurrency has been struggling against broader market weakness, and today’s sharp drop confirms a bearish continuation pattern. With sellers in control, BNB is now eyeing

$BNB, Currently, sellers are in control.Yet again, BINANCE:BNBUSDT.P , failed to break that dailytf barrier, Sellers took control again. i have shared my views about BNBUSDT on this very post, reason to my entry and exist are all on the post, pls take your time out to view the content of the post.

BNB/USD Short Setup – Bearish Continuation?BNB/USD is retracing to the 0.618 Fibonacci level around $595.7, a key resistance zone. If the price fails to break above, a continuation to the downside is likely.
📉 Entry: Around $593-$595
🎯 Target: $588.1, with potential extension to $580
🛑 Stop Loss: Above $597.4
The setup aligns with the down

See all ideas
Curated watchlists where BNBBULLUSD is featured.

Centralized exchange tokens: Stuck in the middle with you
7 No. of Symbols

Crypto tokens: Chips and dips
24 No. of Symbols

Staking Coins: Pick up a stake
18 No. of Symbols

Top altcoins: Choose your alternatives carefully
28 No. of Symbols
See all sparks