BNB(based on NEo wave)I think this complicated correction has 2 ways to show itself, first is bow tie correction and the second is triangle but actually I prefer ETH for holding.
BNBBULLUSD trade ideas

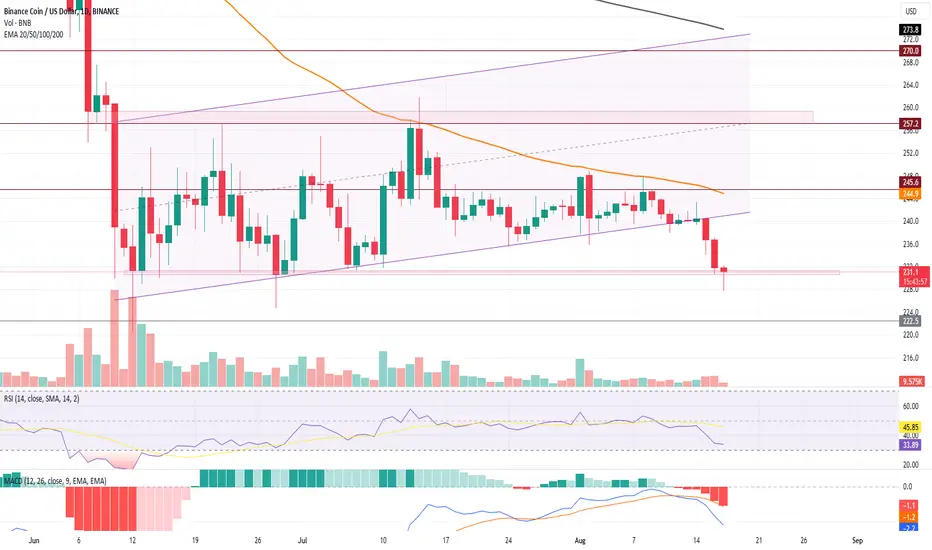
Will $200 Support Propel Binance Coin's Comeback?BNB's resistance trendline dictates its recent price dips.
Binance hovers at $200, with a morning star pattern suggesting potential reversal.
A trendline breakout could signal a robust recovery in BNB price.
Post breaking the $300 mark in June, BNB consolidates between $230-260, later impacted by market FUD.
Persistent resistance at the 50-day EMA pushes BNB below the $230 support.
A hopeful turn at the $200 psychological mark: Signs of buyers returning with the emerging morning star on the 1Day chart.
A 38% decline in 4 months for Binance contrasts with a 2.28% intraday price boost.
Key reversal hinted with the morning star at the significant $200 support; yet, BNB needs to bypass the resistance trendline for genuine recovery.
Technicals: Stochastic RSI and daily RSI are set for a rebound from oversold conditions. Still, the bearish 50-day EMA, aligned with the resistance trendline, heightens bearish outlook.
If buyer strength persists, $200 emerges as an optimal BNB buy
point, with potential to reach $230 before hitting more resistance.
On the contrary, a dip below $200 could intensify BNB's correction, possibly plummeting to $185.

Once again, beware of going downSo far, the price has been moving for a period of 419 days in a large cross area, and this indicates the direction of the discharge and not the consolidation, because the previous drop from the top has not ended, and it must take place in the form of three downward waves. It is going sideways for a period of 419 days.. It will end soon and the strong third bearish wave will be created in order to end the historical correction of the currency and start the rise of a new impulse when the bottom is formed in the shaded area below
Good luck

BINANCE - Do NOT Miss This Trade! Binance is shaping up really nicely.
We are in wave X correction = 335 flat correction. Looking for wave C now. We may break below the structure in which case it will be an expanded flat correction. Entry will remain on trendline break.
Trade Idea:
- Entry on break of red trendline
- Stoploss below the lows after trendline break
- Targets: 300, 395
Goodluck and as always, trade safe!

Binance Short. Is it over? BNBA lot of rumors, a lot of BNB FUD.
Will CZ be holding up the 4, while price avoids collapse?
or will 4 be the new price of BNB?
Find out later this year.

BNBUSD 50 % drop - BewareBNBUSD got rejected at the strong resistance level. We expect it to have a short term bounce together with the whole market and if we retest the strong resistance level again, it will the most likely get rejected .
50 % drop coming. Beware
The problem is that it went very parabolic in the bull market and there´s no much support so if we break our support zone, we can go much lower.
If we have some heavy FUD related to Binance exchange, it may drop to 50 $ or a bit lower and it would be a a great opportunity to buy at those low prices. However, it´s not very likely in our opinion .
Good luck!

Mystery Chart!!!! Time for another "Mystery Chart" !!!!
Enough shares and likes and I'll let you on this little gem I found.
They don't come by very often...
Have a great weekend guys!

Look this viewNice view right ?
3 million and some %
It makes no sense
Can even go back on $30
That wouldn't surprise me...


Will BNB bounce to $250?
BNB coin price breaks below the rising channel support trendline.
The fallout rally challenges bullish dominance at the $230 support zone.
A breakdown below $230 could crash the BNB price to $200.
Altcoins mark a third bearish day this week, leading to a 5.78% drop in BNB in the last 8 days.
Failure to rise above the 50-day EMA and $250 leads to a rising channel fallout.
Binance coin price shows a 3.62% drop in the last two days, with increased trading volume.
The crucial support zone of $230 may provide a reversal spot, with the possibility of a retest as sellers get exhausted.
Technical indicators like MACD and RSI show increased bearish sentiments.
If buyers absorb the supply pressure, $230 could be a bounce pad to reach $250.
A closing below the support zone could mark an intense correction phase, prolonging the fallout rally to $200.
A bull market is more likely than a bear market in cryptocurrencWishing you a fruitful week
I would like to share with you two ideas that I have developed using the Elliott Wave Principle.
For more explanation, refer to the attached chart.
Friends, if you like, you can refer to my previous analysis. I must mention that my understanding of the Elliott Wave principle is based on my personal experience, and while I am still learning, I hope to provide better analysis in the future.
Your continued support is greatly appreciated and I look forward to our mutual success.
Sincerely (Mr. Nobody)
Go up and Never Stop.

BNB CRAZZZZY 1:50RR TRADENot for the faint hearted!!
1:50 rr BNB LONG trade!!!
Entry - 139
SL - 137.6
TP - 309
Major trend line that will either break or hold!
DO OVER LEVERAGE or over size your trade!
#DYOR #NFA #USEAF**KINGSTOPLOSS

LONG BNB RISK 7% RETURN 30%ITS EASY TO SETUP THE TRADE
Beacause the risk of trade is 7% before it break down.
but if we true, we can take more than 30% profit
keep it simple!
CRYPTOCAP:BNB

BNB/USDT LONGNice rejection of the lows...
Short term recovery may be in place
Entry - 239.30
SL - 236.90
tp - 309.00

Bollinger Band SqueezeWhat is a Bollinger Band Squeeze?
• A Bollinger Band Squeeze describes a period in which volatility is extremely low. The narrowing of the Bollinger Bands signals low volatility.
• There is a formula to calculate the level of the squeeze. However, for simplicity, I use the Bollinger BandWidth with High/Low References by Sinier, with a 180-day lookback period.
• You can look at the bottom indicator and see that the orange line, signifying the BB width is as low as it gets.
• According to Bollinger, periods of low volatility are often followed by periods of high volatility. It stands to reason that once the period of low volatility is over, a big move, up or down, will happen.
• For example, In may BNB was squeezed in a 3.41% range, and the following move was a 25% move.
How to determine the direction of the squeeze?
• The squeeze by itself, is a directionless signal.
• Bollinger suggests using momentum indicators, volume-based indicators, divergences, and classical TA techniques to determine the direction of the squeeze.
• Bollinger also suggests practical advice, based on market psychology: when the majority of traders point in the same direction, it’s usually a good idea to go in the opposite direction.
Trade idea:
• I couldn’t get a directional hint by using indicators. However, since we are in a range with clearly defined support and resistance levels, I will take this trade as a breakout trade.
• Support is 235 USDT. Resistance is 250USDT.
• You can take this trade at the break of the Bollinger band, to either side. Or, you can be more conservative and wait for a support resistance flip.
• The SL is the upper or lower boundary of the Bollinger band.

Will BNB Prices Resurface Above $250?Recent Drop: BNB coin price has suffered a recent drop of 9.28%, trending close to the support trendline.
Selling Pressure: An increase in selling pressure may indicate a potential breakdown of the rising channel pattern.
Support Trendline Risk: If BNB breaks below the support trendline, it could crash the price to $222.
Fraud Charge Impact: Consideration of a fraud charge against Binance by the US Department of Justice has negatively impacted BNB prices, causing a 3.63% crash.
Short Recovery: Despite heavy selling pressure, BNB has managed a 1.50% recovery, forming an ascending triangle pattern.
Psychological Mark: $250 is a significant supply spot, and resistance at $245 must be overcome first.
Social Sentiments & Volume: Trading volume normalization and improved social sentiments might indicate stabilization.
Technical Indicators: The Stochastic RSI and MACD indicators point to a positive trend, suggesting potential bullish momentum.
Potential Outcomes:
Optimistic: If the recovery continues, BNB could reach $257, targeting the next at $270.
Pessimistic: If the support trendline is broken, the price may fall to $222.

BNB Bottoming?Pending to breakout above $250-$260 zone, in order to revisit 200MAs ($290-$300). more bear if price go below $230. MACD seems favor to bull side. DYODD. cheers

ready to climbHello friends
The price of the green zone increases and reaches the red zone.
I hope my prediction comes true.

Binance Ready For Breakout? Next stop, $270!
BNB price action projecting a bullish cycle within a rising channel, target $270.
After a 25% fall in June, BNB dropped to $230 but recovered due to strong buying activity.
Rising channel with multiple bull cycles, highest accounting for an 11% jump but failed to surpass 50-day EMA.
Morning Star pattern forming on support trendline, 4-hour chart shows rounding bottom pattern with neckline at $245.
If BNB breaks above $245, target $257; 50-day EMA may resist recovery rally.
Resistance trendline from the previous downtrend may hinder further bullish growth.
Recovery rally lacks significant spikes in trading volume, raising sustainability concerns.
RSI indicator sideways near halfway line, recent uptick suggests potential uptrend.
MACD indicator's signal and MACD lines preparing for bullish crossover.
Bullish scenario: BNB reaches $257 before challenging the resistance trendline at $270.
Downside: Reversal from $245 could lead to fall back to $237.

BNB short currently sideways BNB, BNB could hit $448.23 in 2023
BNB’s price prediction for the most bearish scenario will value BNB at $194.61 in 2023
BNB’s previous All Time High was on 10th May 2021 where BNB was priced at $686.31
BNB’s price at the same time last week was $231.07. It has moved by 0.77% in the past week and is currently at $243.26. Infact, in the past 24 hours, BNB has pumped by 0.32%. There is a slight bearish sentiment in the crypto market. The long term sentiment, however, remains bullish and BNB could hit $475.81 in 2024.
The total circulating supply of BNB as of writing this article was $155,855,196 and the marketcap of BNB remains at $37,914,395,267.
However, Binance’s legal battle isn’t over just yet. The US SEC is seeking restraining orders to freeze Binance’s assets. Although the exchange has asked the court to deny the restraining order, the ongoing showdown could further affect BNB’s value.
The weekly timeframe chart showed that BNB’s plunge has hit June/December 2022 lows. During the December 2022 FUD (fear, uncertainty, and disinformation) around Binance’s proof of reserves, BNB tanked to $220.
The $220 level aligns with a bullish order block (OB) of $206 – $243 (cyan) on the weekly chart formed on 27 June 2022. In addition, it coincides with the range low of a parallel channel (blue) and the 200-MA (Moving Average).
So, it could make the $206 – $243 zone (cyan) a strong bullish stronghold. Unfortunately, it could crack if Binance’s legal woes worsen in the next coming days/weeks. A drop below the confluence area could ease at $184 or $118.
Conversely, BNB could attempt to reverse the losses and target the mid-range ($293) if the demand zone doesn’t crack. The level also aligns with the 50-MA.
In the meantime, the RSI (Relative Strength Index) flattened in the lower range – suggesting selling pressure eased. Similarly, the CMF (Chaikin Money Flow) moved sideways slightly above the zero mark – denoting capital outflows from BNB subsidized.
A break above 359 and creating bullish pa HH and HL is the start of a bullish trend

ALERT FOR BINANCEYes, my #crypto and #bitcoin charts don't get much likes, but still worth sharing for those playing them.
HUGE WARNING STILL ACTIVE FOR #BINANCE.
Share if you care.
notes:
continuation breakdown
!!! WATCH HERE !!!
reverse symmetry move

🟢BNBUSDT🟢NO LIQUDITY SWEAP NO ENTRY.
STRUCTURE IS CHANGING ANYTIME.
EVERY CANDLE HAS LIQUIDITY.
PRICE ALWAYS NEED LIQUIDITY.
Nobody Knows Where is Price Going.
Hey traders, here is the analysi.
If you guys like my analysis please hit like?? and follow.
Thanks.
SMART MONEY CONCEPT.
identify Liquidity Or Become Liquidity
DISCLAIMER- This is not financial advice.
