Do you understand what I've just published? I'm a beginner, and I believe that the levels of resistance and support have been illustrated okay-ish?
May I please receive any advice? Anything you could think of.
Many thanks in advance for your time and answer(if the case).
BNBPERP trade ideas

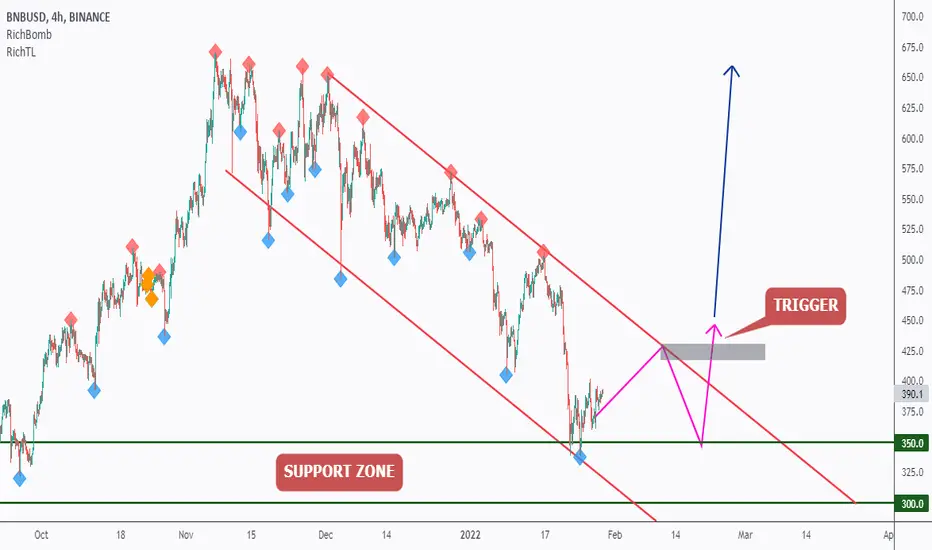
BNB - Potential Bullish Reversal!Hello everyone, if you like the idea, do not forget to support with a like and follow.
BNB is approaching a strong support in green so we will be looking for buy setups.
on H4: BNB is forming a channel in red but the upper trendline is not valid yet, so we are waiting for a new swing high to form around it to consider it our trigger swing. (projection in purple)
Trigger => Waiting for that swing to form and then buy after a momentum candle close above it (gray zone)
Meanwhile, until the buy is activated, BNB would be overall bearish can still trade lower inside the green.
Good luck!
All Strategies Are Good; If Managed Properly!
~Rich
BNB Analysis (28/01/2022)CASE 1 : If we break the Support 1, we reach at Support 2 i.e. $360
CASE 2 : If we break the Resistance 1 i.e. $398, we reach at Resistance 2 or even Resistance 3
Let's see how it plays out.

BNBUSD Descending Triangle Pattern.!#BNBUSD Looking for Sell trade setup as I mentioned in the Chart.!
Keep Supporting LIKE, COMMENT And FOLLOW.!
ThankYou.!

Double Bottom Breakout in BINANCE.Although this analysis isn't really a prediction, because this already happened.
But I'm still making this for just my own trading record.
There isn't much to say about this one, but i'm sure that this is the ideal setup that every trader desires.
Happy Trading !!!

Is BNB in a range ? Prices are stuck between two main areas :
The support, the Monthly Kijun, is a strong one, located at $350 .
The resistance, the Weekly kijun, is also strong and located at $442 .
We could have a range if the market and prices are calming down until the end of the month.
On a shorter term vision, Daily Lagging Span confirm the uncertainty and must stay above Weekly Cloud to confirm a possible bounce.
Let's see how it goes !

BNB LONG set upBased on the Daily pullback FIB, looking for a TP at my zones here.
Further 13-14% TP if any sign of re-continuation patterns occur. This would also take out the highs, finish the retrace and possibly continue lower.
Will see to do and check-in on Oil and Gold markets as these 2 assists are correlated.

BNB LONGTaking full profit in the green box from my short, then planning to go long it PA prints it.
looking for a possible 'W' reversal pattern or something as such as reversal to continue higher. Will be watching this green zone closely and dropping down to possible 5m time frame for an entry as volatility is showing in Crypto atm.
will post Long targets below.
thank you and safe trading

BNB, I'm going LongIt looks like its hit support lows, assuming btc doesn't drop another 50% BNB should be ripe for picking!

BNBUSD UP Trend.!#BNBUSD Looking for Buy trade setup as I mentioned in the Chart.!
Keep Supporting LIKE, COMMENT And FOLLOW.!
ThankYou.!

BNB break out decision pointPrice action currently testing the decending channel and previous range support.
Measured move the decending channel breakout is well beyond the previous range high.
This idea is in the context of my longer term idea below.

GOOD POSITION FOR LONG BNB !Halo , this my spekulasi about BNB ,
THIS 3x time bounce on demand zone, i think this good position buy BNB ,
i think this last chance for BNB can hit under $300 and create new demand zone after bearish time now ..

A falling wedge with EMAsA falling wedge is usually a bullish pattern . However the higher timeframe, the weekly, signals a bearish MACD cross and the daily has a potential daily MACD cross. Both RSI and S. RSI pointing down.
A possible V-Recovery is more likely than a typical Breakout with Retest out of the Falling Wedge .
If more EMAs death cross then BNB is to be seen as in a bearish trend .

BNBUSD (4H) Bullish reversalHi Traders
BNBUSD (4H Timeframe)
Waiting for the upward break of 390 resistance level, which will complete a bullish trend reversal pattern to go LONG. Only the downward break of 337 would cancel the bullish scenario.
Trade details
Entry: 390
Stop loss: 337
Take profit 1: 421
Take profit 2: 474
Score: 4
Strategy: Bullish reversal

BINANCE can Break that 375$ Resistance Zone.After the Russian Dip, Binance coin took support at 335$ and price started rising quickly and in just a couple days it made a new Daily High at 375$, which is apparently acting as a psychological Resistance Area.
The zone has already been tested multiple times but whenever price tries to break it, new sellers enter and price fails to make new highs, that's why we see long upper wicks which indicates selling pressure.
I believe that Binance will eventually break that Resistance and after that we might see new weekly and monthly highs.
Happy Trading!!!


BNB/USD investment ideaBNB/USD:
So when we look at the chart we can see that the price has been moving a lot this year. When we look at the all time high this crypto was up for 1701,48%. As we see now we are still up for about 995% on a year basis. That is still very good.
What we can see now on the chart is that the price has been in a little drawdown for now. From the all time high we are down about 40%.
What does is good now is that we can see that the price is at some sort of support and that we are on the 0,618 level of the Fib from the start of the rising wedge which it did just touch but was unable to go below that level of the Fib. This is also a good sign.
There is a possible rising wedge forming which does look valid for me.In my opinion we do get a lot of touches on the wedge and the price did always reverse when we got a hit on the wedge.
We can now see that the price did go below the wedge but did not close below it so that is a good sign. As long as we do not get to see a close below the wedge I think that we are good and that this stock has a possibility to go back up.
What does not look bullish for me for now are all the MA that I draw on the chart. Normally when they are above the price it means that it is more bearish. When they are below the price that it means that it is more bullish.
As we can see the MA’s are above the price so that could indicate a bearish movement. That is why I will be starting small and growing this investment overtime.
We can see that the price does vary a lot and that the crypto has a lot of movement and a lot of wicks when we look at all the daily closes. This is something good and bad. If you trade this for the longer term than it does not really impact your investment a lot. When we look at this in the shorter term so more in the daytrader view than this could be a problem because then you need to keep that in mind before you set your stop loss level and then the risk-reward of the day trade investment could drop a lot. Even so hard that it is not worth it anymore.
For me this is just a longer term investment that I will take and I will not be trading this for the shorter term.
The reason that I am investing in this crypto is because I think that Binance is a good company and is doing good things. The stock to invest in the company can not be traded on the open market but the coin of the company is the next best thing so that is why I am investing into this company.
If you have any questions feel free to send me a message.
If you like the idea do not forget to give it a like and feel free so share your idea on this in the comments.
Everything you see on my profile is just for educational purposes only.

BNBUSD Down Trend.!#BNBUSD Looking for Sell trade setup as I mentioned in the Chart.!
Keep Supporting LIKE, COMMENT And FOLLOW.!
ThankYou.!

BNB - the end of falling? and another short timing1H trend chart / D trend chart
-
From the right side chart, we can notice that BNB falls seriously while breaking out the uptrend line.
And it is gonna find support with previous accumulation zone, which will be a nice long timing for left side trading.
From the left side chart(1H), BNB might rally back to 410~420 to hit 144/169ema and the broken uptrend line.
It will be a good short level if price meets 144/169ema then gets pullback to 12ema, which meets 1H Vegas shorting entry.
-
Profit Targets:
a) 316.5----Blue horizontal ray
b) 254.6--------Blue horizontal ray
-
If you like this analysis, smash the "like button" and leave a comment below to share your thoughts
or let me know what crypto you want to see!
Trading is a reflection of yourself. Learn more daily and be ready for every opportunity.
Have a nice trading!

BNB - BINANCE 🤠BNB, do we see it at $ 130-170?
That's possible. There is also the FIBO support area, there is also the price support area.


BNBUSD Ascending Channel Pattern.!#BNBUSD Looking for Sell trade setup as I mentioned in the Chart.!
Keep Supporting LIKE, COMMENT And FOLLOW.!
ThankYou.!
