Binance looks like FTX. The BNB coin looks like it will follow FTX based on the chart. IMO there is no way this will not hit $40 and probably $20. All rallies are sold and the bearish wedge is following ftx pattern, I own no BnB or have ever owned any, this call is based on the chart alone.
BNBUSD trade ideas

BNB/USD: short positionBinance Coin show us a nice setup that may to develop in this trade to take this perspective to short BNB.
This it's the H4 timeframe that I see and we see a in the bearish perspective.
Good luck
I put a sell order place in $241.40 USD and SL to $254 USD and take profit to $207 USD

The Future of Binance?Will we see a 90% drop here? There's reason to think this company has some issues. We have a descending triangle and strong volume node down below. Not financial advice, DYOR.
www.reuters.com

Binance flerting with collapse!Binance coin... one of the main asset owned by binance company is on brink of a big collapse.. i would warn all out there to be very cautious now with them... they might be the next FTX ... but just follow the trend...

BNB ShortBinance Coin (BNB) is going to collapse.
This is purely a TA signal, not related to fundamental analysis/rumors.

BNB/USDHello friends
Today we will see BNB/USD
We don't seem to have much traffic at the moment the price is stuck at the specific point of 282-284. Price should break 286-287 and go ahead to break 293 and hold 300 to be able to make a higher high
otherwise it will make 279-273 easy and we might see 270 as well and if he can't keep it we will see 260 or even lower low. I suggest that we do nothing for now
until we see some trend-volume on the charts .
.
.
Lower low : If the price of a security closes at a lower price than it did at the close of the previous day, which was also a low, then it is referred to as a lower low.
If you liked this idea or if you have your own opinion about it, write in the comments.
Thanks for reading!

BNB: AT THE SUPPORT LINE.BNB/USD Update:
BNB is at the support trendline. It may land into some big trouble if it fails to hold the lower trendline ($260). A healthy bounceback could possibly pull back the price toward $360. So, BNB hodlers be cautious with your positions.
Note: The analysis is on a daily candle so do not consider this as a scalping trade setup.
Trade safely.

BNBNot financial advice.
The essence of investing & trading is the intelligent and patient preying on the greed, fear, impatience, addiction and ignorance of the majority. It's definitionally Darwinian.

bnb wow bnb is at its critical support MY field of intrest to LONG IS mentioned in the chart FUNDAMENTS ! are going to be good for binance i think it will boom soon

BNBUSD H4: 35% correction warning distribution(SL/TP)(NEW)Why get subbed to me on Tradingview?
-TOP author on TradingView
-2000+ ideas published
-15+ years experience in markets
-Professional chart break downs
-Supply/Demand Zones
-TD9 counts / combo review
-Key S/R levels
-No junk on my charts
-Frequent updates
-Covering FX/crypto/US stocks
-before/after analysis
-24/7 uptime so constant updates
🎁Please hit the like button and
🎁Leave a comment to support our team!
BNBUSD H4: 35% correction warning distribution(SL/TP)(NEW)
IMPORTANT NOTE: speculative setup. do your own
due dill. use STOP LOSS. don't overleverage.
🔸 Summary and potential trade setup
::: BNBUSD 4hours chart review
::: updated/revised outlook
::: distribution in range / weak chart
::: limited upside going forward
::: weakness will last for 4-8 weeks
::: LOG SCALE chart
::: not a great looking chart
::: BEARS maintain strategic control
::: S/R was re-tested produced WEAK bounces
::: final BOUNCE possible now before DUMP
::: also noteworthy sequence of lower highs
::: recommended strat: SHORT from range highs
::: final TP BEARS is 200 USD
::: 30-35% correction possible next
::: 4-8 weeks in December/Jan uary 2023
::: right now no upside in this market
::: BEARS can short near range highs
::: better entry prices later after (BULLS)
::: recommended strategy: SHORT SELL RIPS/ RALLIES
::: TP BEARS is +35% gains - near 200 USD
::: BULLS stay out until correction is over
::: SWING TRADE: SHORT/HOLD IT
::: correction run not over yet
::: good luck traders!
::: BUY and get paid. period.
🔸 Supply/Demand Zones
::: N/A
::: N/A
🔸 Other noteworthy technicals/fundies
::: TD9 /Combo update: N/A
::: Sentiment mid-term: BEARS/CORRECTION/200USD
::: Sentiment short-term: BULLS/BOUNCE/330USD
RISK DISCLAIMER:
Trading Crypto, Futures , Forex, CFDs and Stocks involves a risk of loss.
Please consider carefully if such trading is appropriate for you.
Past performance is not indicative of future results.
Always limit your leverage and use tight stop loss.

$BNB VS $FTT FRACTALI don't necessarily believe the fud surrounding Binance entirely, I don't think the situation will be nearly as bad as FTX. However, If it is as bad it could follow a similar pattern as FTT, the charts look scarily similar. Even if not, I think BNB still dumps pretty hard from here, regardless of how bad their situation is.

BNBUSDStink bidzone hit and a massive reaction from that zone, @coinmamba 's account got deaxtivated for a twitter critisizm, but its literally 1 account, given the overall response i doubt that happens many more times, maybe cz goes fulls sbf crazy, does crpyto volatility just wear down participants sanity over time or can exchange owners sit back and chill for abit, time will tell, my thoughts are this is short term fud tbh
Dxy macro top is (clearly?) in, markets will react strongly if it starts trending solidly back down.

Binance - BNB - Stay rationalDespite recent FUD, BNB stays above critical support (green horizontal line)
It might be tempting to short but should wait til support is clearly breached
I'd rather have a potential 10$ profit with 70-80% probability than 20$ with 50% probability (just an example)
Not financial advice

BNB going to REKT Soon BNB is looking so bad right now, i feel like it will go below $100 this year, the bubble is about to pop.
Yeah binance fans aren't happy, also there are so much fud related to binance. but yeah it's going to happen we will get another chance to buy BNB below 100$ probably close to $50.
it might sound crazy but it will eventually happen !!

BNBUSD (4H) - Bullish reversalHi Traders
BNBUSD (4H Timeframe)
Waiting for the upward break of 292.20 resistance level, which will complete a bullish trend reversal pattern to go LONG. Only the downward break of 284.40 would cancel the bullish scenario.
Trade details
Entry: 292.20
Stop loss: 284.40
Take profit 1: 297.00
Take profit 2: 304.50
Score: 4
Strategy: Bullish reversal

Binance Coin: slow motion continuesIt was a relatively relaxed week for BNB as the coin was moving within quite a short range during the whole previous week. BNB started the week below the resistance line at $300 and finished above $280. It is more than evident that the market is on hold and that investors continue to be reluctant to take positions. Extremely decreased daily trading volumes adds to this fact.
In line with spot prices, RSI was also moving in a short range, oscillating below level of 50. It also confirms the prior statement that investors need more fundamental information in order to decide on a trading side. Moving averages of 50 days continue to move away from its MA200 counterpart in a relatively slow mode, but still, confirming the golden cross formation from the beginning of November.
The FOMC meeting is scheduled for November 14th, while a day before the US inflation data will be published. This is an event where the market might reach its higher volatility, in case that posted figures are not in line with market expectations. As per current charts, there is probability that BNB will continue to move within a relatively short range between $250 support and $300 resistance.

1 hour charts bnb harmonics abcd custom weekly harmonics anti crab- on weekly- but running this chart on the 1 hour charts----stay classy

BNB IDEAHELLO GUYS THIS MY IDEA 💡ABOUT BNBUSD is nice to see strong volume area....
Where is lot of contract accumulated..
I thing that the sellers from this area will be defend this SHORT position..
and when the price come back to this area, strong sellers will be push down the market again..
DOWNTREND + SUPPORT from the past + Strong volume area is my mainly reason for this short trade..
IF you like my work please like and follow Thanks

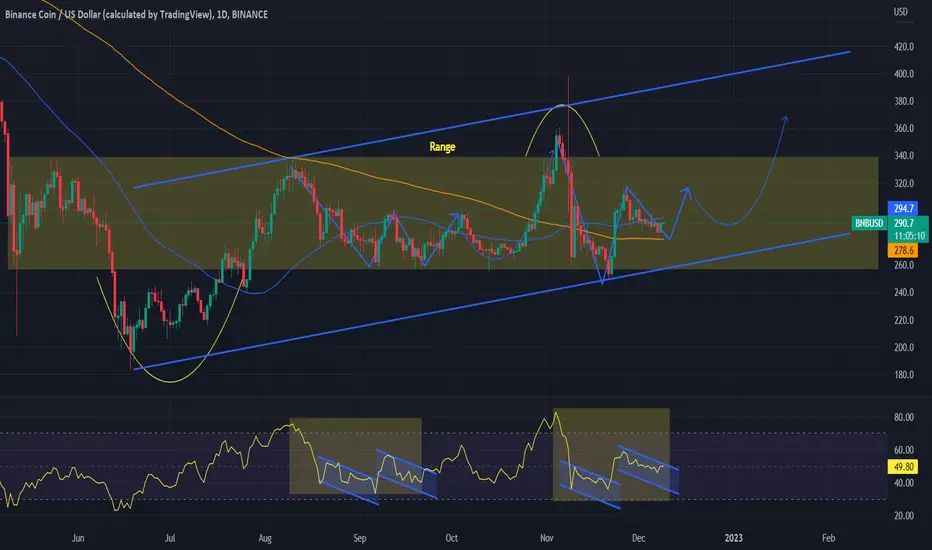
BNBUSD can see a big upside if it breaks out of this rangeThe Binance Coin is trading in range, a wide belt that is holding since mid May and has broken only twice. Besides that, we see a Channel Up since June 18.
Perhaps the strongest formation right now it the repetition based on the RSI of the August/September price action. If extended, this can break above the range and within 380 - 400, which will make a Higher High on the Channel Up.
Please like, follow and comment!!

BNBUSDT Price reached an exhaustion point, price should return to the significant zone which is marked by the take profit

BNBUSD ShortThere is a pennant forming, and I highly anticipate that the price might break out of the rising flag (according to higher timeframes) which is a strong indication of a bearish formation.
Entry at 295, SL at 306 Targets at 284, 273 and 261.

BnbusdPumpit by december 12? Or around then ?
Falling wedge is completed around here back to 300+?
220ish days of ranging from 330-250zone
Ftxs collapse really does solidify this exchanges longterm survival and the prevalance of bsc +dev community
Means this things assured to be a strong performer in any potential relief rally scenario, barring cz goes to jail or something like that.
Compression leads to expansion, the longer the compression the greater the expansion.
