Binance Price Analysis — August 12Binance Coin (BNB) held on to its bullish bias on Friday after dropping from the $335 area yesterday. The smart chain cryptocurrency slowed its descent at the $320 low, where my multi-month tripwire coasts and has since bounced off the line.
We could see a bullish continuation over the weekend, with BNB breaking the $340 line for the first time since early May as the cryptocurrency industry continues to lean towards ending the ongoing bear cycle. At the same time, we could see a quiet tone over the weekend, as has been commonplace in the last few weekends. Either way, I do not see a bearish sentiment taking precedence this weekend.
Meanwhile, my resistance levels are $340, $350, and $360, and my support levels are $320, $310, and $300.
Total Market Capitalization: $1.19 trillion
Binance Coin Market Capitalization: $52.5 billion
Binance Coin Dominance: 4.5 %
Market Rank: #5
BNBUSD trade ideas

BNBPERP 4 HR Bearish DivergenceDaily resistance - rejection
Bearish divergence -RSI
Bearish divergence -Momentum
Golden pocket at target before the
4hr resistance


#btcstarburst The Crypto Giant, NOT BITCOIN?Its interesting what this Giant can and will do… they are constantly burning tokens quarterly… They will at least hit 2k at some point… pretty good return I guess They offer 5% on staking that compounds. HMMM… Not sure what to think about them BNB seems like a good bet. I always DCA into the just because, regardless of what I think of them…This is a Gann Study… DCA Safely.

BNBUSD SHORT✔Our analysis is based on multi-timeframe top-down analysis & fundamental analysis
Based on our view the price will drop to the monthly level
DISCLAIMER: This analysis can change anytime without notice and it's only for the purpose of assisting traders to make independent investments decisions. Please this is a PREDICTION and I have no reason to acts on it and neither should you
Please support our analysis with a like or comment!

BNB.USDT Daily RR 1-2"If you can't beat the fear, do it scared!"
"Be fearful when others are greedy, and greedy when others are fearful!" - Warren Buffet.
"Markets are a device for transferring money from the impatient to the patient. - Warren Buffet
"Show me the charts, and I'll tell you the news." - Bernard Baruch
"The secret to investing/trading is figuring out how rich you want to be and how poor you're willing to become."
"If you want to live like the 5% of the population who are hugely successful, then don't act like the 95%!"

Binance Coin: overbought market reached Another positive week is behind BNB. The coin managed to reach another currently significant target of $300 resistance line to be clearly tested and breached as of the end of the week. Although BNB started the week around level of $275, dominant buying orders have pushed the price to the highest weekly level at $320. With this move the overbought market has been clearly reached, indicating that the future might bring some short term reversal for this coin.
As of the end of this week RSI was pushed to the level of 72, clearly indicating that the market is currently traded in the overbought zone. At the same time, the moving average of 50 days started its modest convergence toward its MA200 counterpart; however, it is still early to confirm this trend. The golden cross is still far away from this coin.
Considering that the coin reached the overbought side of the market, it might be expected that short term reversal is ahead. In this sense, the coin might revert back to $300 support line to test it once again, with decreased probability that $250 support might be reached again. On the opposite side, the next target for BNB might be $350 resistance, after a short stop at $330.

BNB reach to the sensetive zoneafter confirmation and according to the fundamental news we are looking for short positions

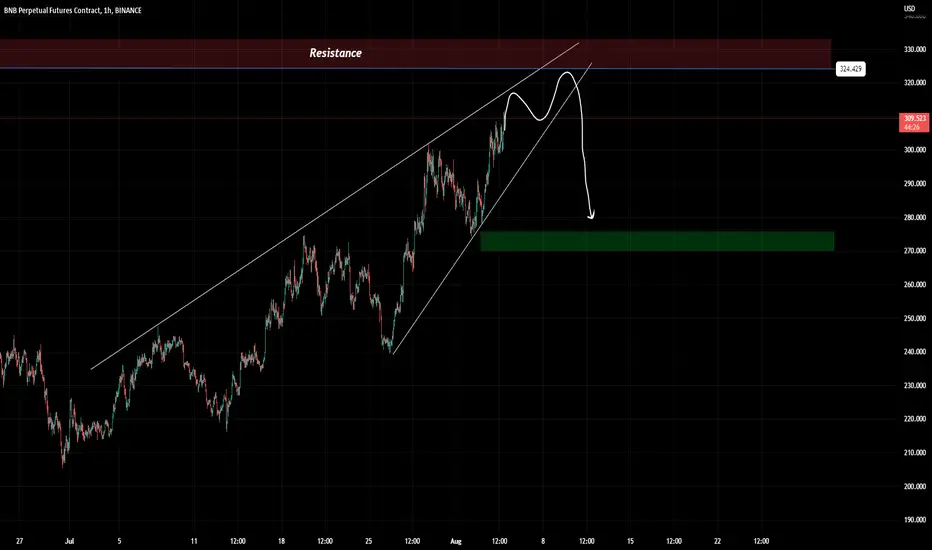
BNBPERP pullback before continuationBNBPERP pullback on broken trendline before continuation
Entry 311
SL 326
TP 265

BNB/USD SHORT TRADE ANALYSISBNBUSD Short Trade Analysis using AB=CD Bearish Pattern
Entry: 312.5
Stop Loss: 320
Take Profit: 312.4


BNB POTENTIAL BREAKOUTBNB is one of the best performing asset in the Crypto space in my opinion, check out this Potential Breakout.

BNB Coin has formed a rising wedge! What's next ? ! subscribe and stay tuned for new ideas. Every day I post profitable ideas a day.

BNB Short liquidity testBreak of structure and RSI overbought with divergence, is usually a good signal for trade

BNBUSD ❕ downward channelThe BNB is above liquidity.
Price has entered the bearish RSI zone (4H TF)
Main MAs are bearish (30m TF)
I expect further downside once BNB has consolidated below the support level.

BNBUSD Short Week 08 Chart 02Taking a short position on BNBUSD based on the formation of a head and shoulders chart pattern. The neckline support has been broken.
Based on this analysis as well as the formation of 5 consecutive red candlesticks, it appears that the chart will continue its downward trend


Binance Coin: overbought market is closeIt was a good week for BNB, as the coin managed to reach its short term target at the $300 resistance line. With the latest move, price was moved close to the overbought market, but it still has not been clearly reached, leaving some space for price`s further move to the upside.
BNB started the previous week by testing a $250 support line. Minimum price level has been reached at $240, when the coin reversed to the upside and clearly headed toward the resistance at $300. Such a move was clearly marked on the charts two weeks ago. At the same time, RSI was pushed to the level of 68, however, a clear overbought level has not been reached, which leaves some space for the price to test higher grounds. Moving averages of 50 and 200 days continue to move as two parallel lines, still without indication that convergence might soon start.
BNB reached its long awaited target at $300 resistance. In the coming days it might be expected for this level to be tested for potential for a move to the upper side. This might bring RSI to the clear overbought market, when the price might start its short term reversal. At this point, there is no clear indication on the charts that the price might go much higher from current levels, within the next few days. In case that price enters into short reversal, then it might head toward $250 support to test it once again.

Binace Coin (BNB) is breaking out! BNB is breaking out of a large Falling Wedge, the 1-week average 100 (the yellow line) is $ 304 near the $ 325 and $ 365 resistance.
We are currently priced at $ 300 if the Wall Street market and Bitcoin turn up and put an end to this Bear Market we would have strong price growth.
Great investment and great crypto, the star of Binance.

Sell BNB at 298BNB is approaching 298/300
We would see slight retracement to 275 level.
if broken 250 level next.

BNB/USDT TECHNICAL ANALYSIS Hello Traders.
I'm not much sure but IMO BNB is still in a corrective move & that is almost completed.
now we need to short it & keep stop loss above 127% of the FIB level.
Thanks & print more money as you want. just follow & stay tuned.
