BNB BREAKOUT 4H SCALP ONLY
This is a short update for BNBUSDT, BTC Break $38,500 area, for a short term you could scalp BNBUSDT as price given
LONG BNBUSDT
ENTRY: 388.2
SELL: 399 - 416 - 438
BNBUSD trade ideas

BNB TURN INTO BULLISH FOR SHORT TERM
The Crypto market seems to turn bullish since BTCUSDT Success to break 41K. Keep in mind, this is a short-term signal. so close your position as long as it's hit the TP.
Open Long Position Now: $429
Close/TP: 440 - 450 - 460
INVALID: BTC DROP TO $41100
Leverage : 5x - 10x max
Congrats to someone who follows this signal
Keep your position with stop loss = entry position + profit

Binance can break short term resistanceAfter it has find strong support at 340, Binance coin has started to rise and has made a higher low last week at 360
Now the coin is consolidating above 400 figure and is probable to have a new leg up after this consolidation
475 and 500 are targets to the upside and a dive under 370 would negate this scenario


BINANCE FINALLY BREAKS THE 400$ BARRIER!!!!!A couple weeks ago I posted an idea saying that Binance will eventually rise and form a strong rally, which it finally did today.
T O T H E M O O N
Happy Trading !!!

BNB seems supported?price seems like stabilize above $350 level.
MACD started to crossed over.
might takes time for sideways. but seeing potential bull making a come back.
DYODD


BINANCE Support Breakdown Retest Entry.If anyone wants me to explain this chart analysis to them, then please comment and let me know.
P.S: I'm getting into the habit of posting multiple Ideas per day and that's why i'm not willing to put much time and effort into describing my analysis. However, I'll be more than glad to explain the ideas later on to anyone, who's got subjective and non-linear questions.
With that being said...
Happy Trading !!!

Bitcoin 02.02.2022 - Forecast [Update]Just an update about the final move up before BTC starts descending most likely till $800 but it might reverse sooner and I plan to see it before happening

Binance Coin Monthly pivot-point -2202Support and resistance are refer to price levels on charts that prevent the price of an asset from getting pushed in a certain direction.

BINANCE COIN EASY + PROFITABLE SETUP.So, what you all actually see is a Descending Triangle Pattern formed in Binance Coin.
A descending triangle is a part of the 3 famous triangle patterns, namely:- Ascending, Descending, Symmetrical.
All these patterns are some way or another part of Price Action Trading. In this case the upper trend line indicates lower highs and the bottom line indicates equal lows(~).
And eventually, price breaks the pattern and a Bearish Breakdown occurs.(Keeping in mind that the break may vary in the other two patterns).
After the price took a little support, it went back up and retested the previous support which is generally when most of the traders prefer to enter and make a position, as it's the safest entry possible in the given circumstances.
With that being said...
Happy Trading !!!

BNB 382 LONG
BNBUSDT is aligning for a bullish opportunity at 382 towards 403
-Price respecting FIB levels 382-618
-Targetting the FIB extension levels
.13 @403.5
.272 @412
-Trade idea invalidated on the structure break of the 4th Wave
My style of trading focuses on flowing with the trend, and patiently waiting for the story price reveals. Fibonacci, Harmonic Patterns , Wave Sequences, Price Action, and a mixture of Multi-Time Frame Confluence. Most importantly the visual realization of emotions cycled into the chart.
As always THANK YOU and if you found this video helpful, please let me know by giving a like and/or leaving a comment below.
Also, feel free to share your opinion on this setup or any other. The more ideas we can generate together, the more information we can spread to the trading community, LOVE & PEACE!
~T$


Do you understand what I've just published? I'm a beginner, and I believe that the levels of resistance and support have been illustrated okay-ish?
May I please receive any advice? Anything you could think of.
Many thanks in advance for your time and answer(if the case).

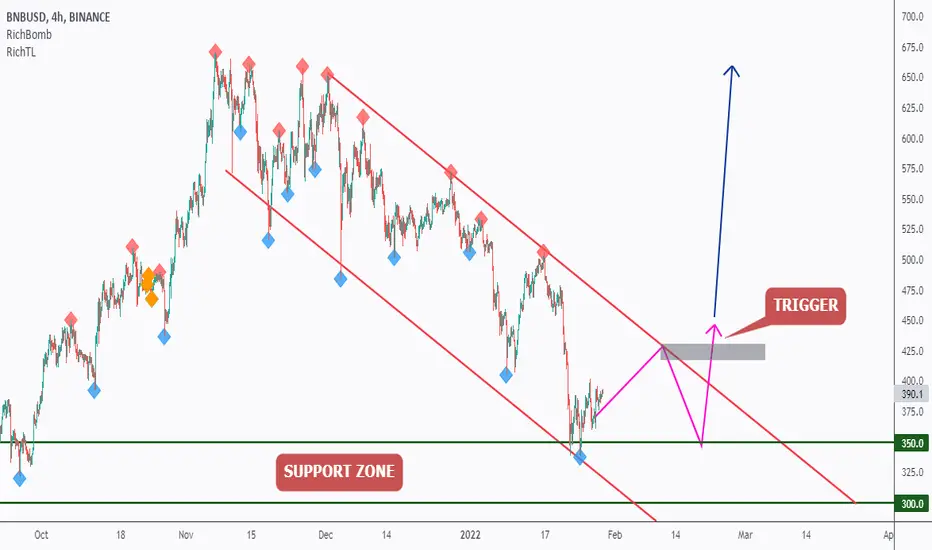
BNB - Potential Bullish Reversal!Hello everyone, if you like the idea, do not forget to support with a like and follow.
BNB is approaching a strong support in green so we will be looking for buy setups.
on H4: BNB is forming a channel in red but the upper trendline is not valid yet, so we are waiting for a new swing high to form around it to consider it our trigger swing. (projection in purple)
Trigger => Waiting for that swing to form and then buy after a momentum candle close above it (gray zone)
Meanwhile, until the buy is activated, BNB would be overall bearish can still trade lower inside the green.
Good luck!
All Strategies Are Good; If Managed Properly!
~Rich
BNB Analysis (28/01/2022)CASE 1 : If we break the Support 1, we reach at Support 2 i.e. $360
CASE 2 : If we break the Resistance 1 i.e. $398, we reach at Resistance 2 or even Resistance 3
Let's see how it plays out.

BNBUSD Descending Triangle Pattern.!#BNBUSD Looking for Sell trade setup as I mentioned in the Chart.!
Keep Supporting LIKE, COMMENT And FOLLOW.!
ThankYou.!

Double Bottom Breakout in BINANCE.Although this analysis isn't really a prediction, because this already happened.
But I'm still making this for just my own trading record.
There isn't much to say about this one, but i'm sure that this is the ideal setup that every trader desires.
Happy Trading !!!

Is BNB in a range ? Prices are stuck between two main areas :
The support, the Monthly Kijun, is a strong one, located at $350 .
The resistance, the Weekly kijun, is also strong and located at $442 .
We could have a range if the market and prices are calming down until the end of the month.
On a shorter term vision, Daily Lagging Span confirm the uncertainty and must stay above Weekly Cloud to confirm a possible bounce.
Let's see how it goes !

BNB LONG set upBased on the Daily pullback FIB, looking for a TP at my zones here.
Further 13-14% TP if any sign of re-continuation patterns occur. This would also take out the highs, finish the retrace and possibly continue lower.
Will see to do and check-in on Oil and Gold markets as these 2 assists are correlated.

BNB LONGTaking full profit in the green box from my short, then planning to go long it PA prints it.
looking for a possible 'W' reversal pattern or something as such as reversal to continue higher. Will be watching this green zone closely and dropping down to possible 5m time frame for an entry as volatility is showing in Crypto atm.
will post Long targets below.
thank you and safe trading

BNB, I'm going LongIt looks like its hit support lows, assuming btc doesn't drop another 50% BNB should be ripe for picking!

BNBUSD UP Trend.!#BNBUSD Looking for Buy trade setup as I mentioned in the Chart.!
Keep Supporting LIKE, COMMENT And FOLLOW.!
ThankYou.!
