BNBUSD trade ideas


A Crypto in a minority that's bullish today. Binance Coin BNBUSD
Binance are usually right on cue with their Crypto ownings. The chart patterns are usually suggestive of bullish buy positions.
I checked this on mulitple timeframes. It looks to be at its record high price. Certainly one to watch.
At time of writing Bitcoin is also in supply mode. I would not recommend a short trade in it as such, only because its very volatile and it switches between buy and sell sides faster than any instrument I think of.
Also bearish right now is dogeusd and many others.

BINANCE COIN (BNBUSD): Bullish Wave is Coming
Binance Coin leaves one more strong bullish clue.
After a strong bullish wave, the price formed a falling wedge pattern.
Its breakout is a strong bullish signal.
With a high probability, growth will resume soon and the price will
reach at least 683 level.
❤️Please, support my work with like, thank you!❤️

BNB will soon head to the moonThis analysis is an update of the analysis you see in the "Related publications" section
It seems a large triangle is nearing completion. If wave E reaches the green zone, it will be the best investment opportunity.
The target could be 4K and 9K.
Closing a weekly candle below the invalidation level would invalidate this view.
For risk management, please don't forget stop loss and capital management
Comment if you have any questions
Thank You

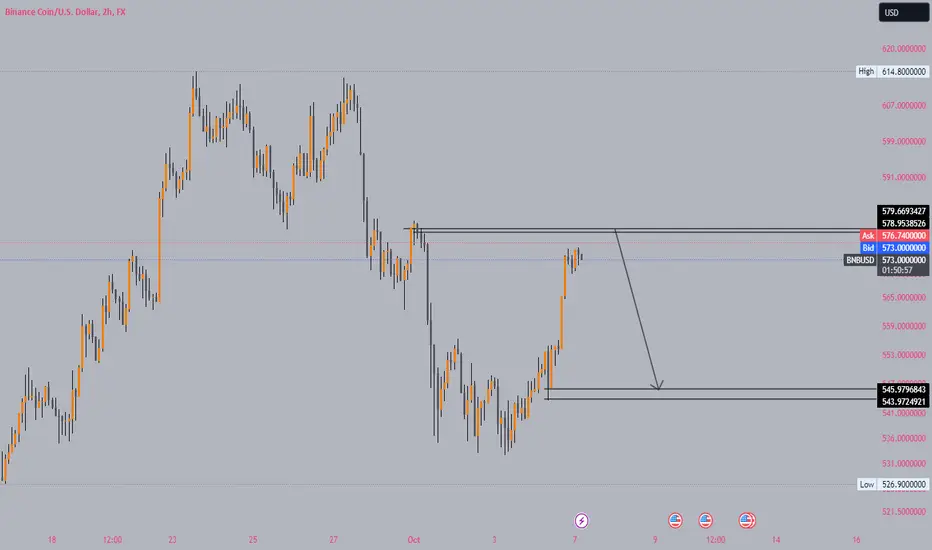
BNBUSD SELL ANALYSIS RISING WEDGE PATTERN Here on Bnbusd price form a rising wedge pattern now try to fall so if line 598.1 break there is a chance to fall more and trader should go for SHORT and expect profit target of 547.8 and 488.7 . Use money management

BNB Breaks Potential for New HighsAfter consolidating within a triangle pattern for an extended period, BNB has broken out above strong resistance and is now trading at $625, approaching its all-time high (ATH) of $720. If the newly established support holds, potential targets to watch are in the $1,000–$1,300 range.
Currently consolidating just above the breakout level, BNB shows strong momentum with the potential to surpass its previous ATH. However, caution is advised as unexpected pullbacks could send the price back to the $400+ zone, where support may be found.
Kindly like and follow for more chart ideas and insights.
NFA: This is not financial advice—always do your own research and trade responsibly.


BINANCE COIN (BNBUSD): More Growth is Coming
BNBUSD is retesting a significant demand zone based on a rising trend line
and a recently broken horizontal neckline of a huge ascending triangle pattern.
The market has a great potential to continue growing.
First, we can expect a test of November's high - 660
and a consequent continuation to 700 level.
❤️Please, support my work with like, thank you!❤️

$bnb will run with the memecoin listings on binanceListing memecoins on binance, brings in more eyes on binance. and to get the fomo binance will push CRYPTOCAP:BNB higher. sooner or later. so great spot buy in this prices

BNB Finally broke resistance!After so many attempt above yellow line by reaching 0.31 Fib Level, BNB finally broke resistance and closed a candle with a shadow above the 0.31 Fib level, potentially heading towards 700$ and higher targets.

BNB/USDWould you like a cup of tea?
Cup and handle patterns are typically bullish continuation patterns, with the handle representing a final consolidation before a potential breakout.
If BNB breaks out of the current consolidation range with momentum, reaching the target at 1,300 USD would yield a 100% return. However, a failure to break out or a false breakout could lead to a pullback, potentially back into the consolidation zone

Binance Coin (BNB) - a wide channelBNB has been oscillating in a wide channel since Feb last year (2021); almost ideal situation for swing traders.
Now, since last Jun, BNB started a upward (impulse) wave and recently broke a major downtrend line, and now an inverted wedge as a correction pattern is almost finished. Can we see BNB reach the upper line of the channel? or even break the channel and ascend further? Yes? maybe?
Well, not so soon. Have to wait for BTC to break some major lines, Fed's next Wednesday meeting and see how stock market will react!
Also market is acting strange today: SPX up, DXY up and BTC is also up. So be careful :)

Market goes Uptrend Market make double bottom pattern
Market move uptrend after breakout of rectangular pattern
Its clear sign of uptrend

BNBUSD VIew!!The Blockchain Forum 2025 takes place in Moscow with over 12,000 guests from 100 countries. Such large events often bring attention to featured projects and can lead potential investors to buy tokens like BNB and Bitget. The gathering opens opportunities for partnerships and announcements that could trigger price movements. Being global, this event might boost the visibility of participating cryptos, creating a positive impact on their prices. However, it will depend on the news and deals shared during the event.Read more.

Buyers Gradually Losing Momentum On BNBUSD? While BTCUSD RocksCheck my previous Idea on BNBUSD and see if you can find something unique about trading alongside the traders best friend; the trend.
I am not that experienced, no not with just 3 years in the system, but I keep asking myself and other traders one simple question... What will you do when a pair is buying? Sell the pullback? and expect it to break through the last support of the trend? Wow, just wow.
Cause when I went through the latest idea on BNBUSD I saw traders making this same mistake of thinking the market is overbought, so it's time we start forcing it to respect our analysis.
Here in this field, I think those that know the trend and trade alongside it, "shall be strong and do exploit," just by adding it a little and simple confluence to their knowledge of what the trend is saying, this confluences will then determine the right spot for an entry, to avoid being taken out with the liquidity sweep. Because a wise man once said, "If you can't find the liquidity, then you're the liquidity."
What's your thought on BNBUSD, more highs? Or we're still going to experience another major pullback lower than the one that touched $405, before the next bull run?

Short term bnb analyse It seems that in this chart, you are expecting a price drop, especially after reaching the resistance level marked at the 0.786 Fibonacci retracement around $600. Additionally, you are predicting that after this decline, the price may fall to the support level near $566 (the orange line).
It looks like the overall trend is still bullish, but a temporary correction in the price is likely. If the support level holds, another upward movement may occur.
This analysis is based on Fibonacci levels and classic patterns, and if other indicators or data are available, they can also be considered.

BNB Testing Resistance - Bullish Momentum Intact Disclaimer: This is not financial advice. Most traders lose money. Trading in digital assets, including cryptocurrencies, is especially risky and is only for individuals with a high-risk tolerance and the financial ability to sustain losses.

All Eyes On The Binance Coin, Join At Your Own Expense.BINANCE:BNBUSD
Looking at the 1Week timeframe, a more responsible timeframe to start a top down analysis on a cryptocurrency pair, the last long green candle evolves from the last created support leaving a fair value gap behind, thereby making that very support zone a valid one. Filling the gap to the demand zone is just the work of the sellers and can be seen as the pullback.
In other words, a lower timeframe is required to see clearly the structures produced by the buyers, ofwhich placing your entry on the last created structure and your stop loss slightly below the higher low minimizes your risk and maximizes the return. An instance on the 4Hr timeframe of BNBUSD, same timeframe where the liquidity is clearly visible as well, when the pullback breaks through the trend line(liquidity) into the demand zone, the uptrend just irresistibly continues until it makes a new higher high.

BNB Price Analysis: Potential for Significant GainsBinance Coin (BNB) has recently shown strong upward momentum, reaching $614. This rally has sparked speculation that BNB could rise even further, potentially reaching between $700 and $1,000.
Key Factors:
1. Recent Rally: BNB surged to $614, marking a 25.7% gain over three weeks. This is the first time BNB has closed above this level since June 2024.
2. Support and Resistance Levels: Key support levels are around $555, while resistance levels are near $620. Breaking past these levels could indicate significant price movements.
3. Market Sentiment: Positive market sentiment and technical indicators support the possibility of a bullish breakout. Traders believe that BNB’s recent resilience signals that the bullish trend may be just beginning.
Potential Risks:
1. Market Volatility: The crypto market is highly volatile, and sudden market downturns could impact BNB’s bullish outlook.
2. Network Activity: A decline in BNB Chain’s DApp volumes and network fees could pose risks to BNB’s price stability.
In summary, while Binance Coin shows promising signs of potential gains, it’s crucial to monitor key support and resistance levels and stay updated on market trends.

BNB - Pump or Dump ?BNB is again fighting again the mega resistance. Will it reclaim it as support, or will we see a big dump ?
Not financial advice.

Will BNB Price Cross $700?BNB price action is currently in a short-term recovery phase, with an ascending triangle pattern forming near the $600 psychological resistance.
The altcoin has been consolidating between $464 and the $600 supply zone, with BNB trading at $583 after a 2.91% recovery.
BNB is trading above both the 50-day and 200-day EMAs, signaling strength in the price action.
The 50% Fibonacci level at $587 acts as immediate resistance, but a bullish engulfing candle suggests an increased likelihood of an overhead breakout.
The 50-day and 200-day EMAs show a sideways movement in a positive alignment, giving a neutral trend signal.
A bullish crossover in the MACD and signal lines near the resistance level strengthens the chances of a breakout.
If BNB breaks out, potential targets are $711 and $863 based on Fibonacci extensions.
On the downside, critical support levels include the local trendline and the 23.60% Fibonacci level at $522.

BNBUSD View!!Another bullish call for Bitcoin came from JPMorgan, which believes investors are turning toward gold and Bitcoin.
“ ising geopolitical tensions and the coming election are likely to reinforce the ‘debasement trade’ thus favoring both gold and Bitcoin,” JPMorgan said in a report shared with Cointelegraph.