BNB / USDT - Downfall AheadEvening friends,
Lotta hype on this coin right now, but I have to leave my thoughts here.
Its straight forward so I won't take long here, just read the notes and let me know what you think.
Trade thirsty!
BNBUSDT.3S trade ideas

Short trade
15min TF overview
Trade Breakdown – Sell-Side (Intraday Crypto Setup)
📅 Date: Saturday, April 5, 2025
⏰ Time: 9:00 AM NY Time (NY Session AM)
📉 Pair: BNB/USD
📉 Trade Direction: Short (Sell)
Trade Parameters:
Entry Price: 592.98
Take Profit (TP): 586.78 (+1.05%)
Stop Loss (SL): 594.97 (-0.34%)
Risk-Reward Ratio (RR): 3.12
Reason: Based on the narrative of supply and demand, ideally taken after a bearish confirmation on the 15min and BTCUSD pair as confluence for directional bias confluence

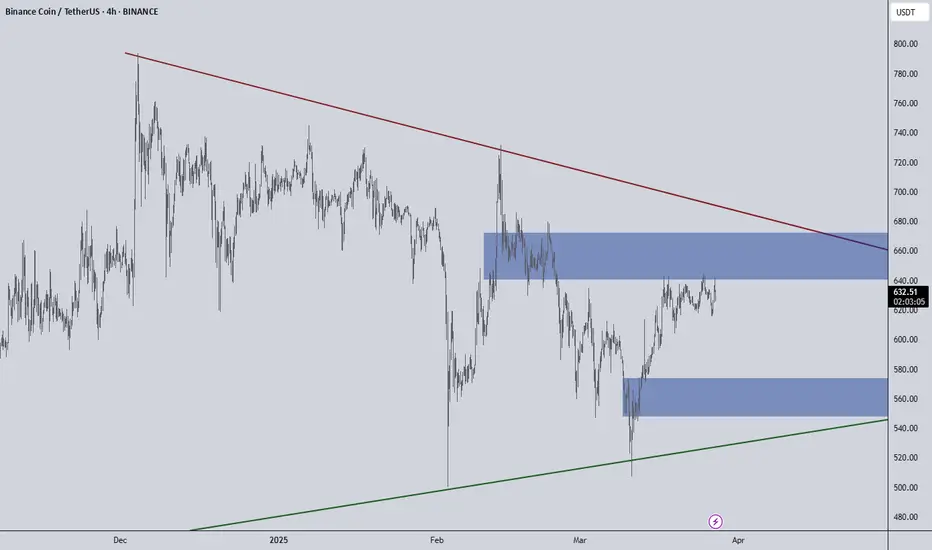
BNB Nearing Key Resistance – Breakout Incoming?🚀 BNB 4H Chart Update!
📉 BNB remains inside a descending parallel channel, edging closer to a critical trendline resistance.
⚡ A breakout above this level could spark bullish momentum, potentially sending prices higher!
👀 Watch this zone closely—volatility is heating up! 🔥

TradeCityPro | BNB: Analyzing Its Position in the Crypto Titans👋 Welcome to TradeCity Pro!
From today, we're returning to our usual routine on the channel, where we will provide two altcoin analyses and one Bitcoin analysis daily.
🔍 In this analysis, I want to review the BNB coin for you. It's one of the most important cryptocurrencies, with a market cap of $84 billion, ranking 5th in CoinMarketCap.
👀 This coin is officially for Binance exchange and is part of the projects that are profiting from the crypto space with a positive balance sheet. Let’s technically analyze this coin as well.
📅 Weekly Timeframe
In the weekly timeframe, as you can see, there is a very large range box from 208 to 662 where the price has been moving since 2021.
💫 Currently, in the last leg where the price moved, it was supported at the area of 208 and began to form a base, then after breaking 352, it started an upward movement up to the resistance area of 662 to 746.
✔️ After reaching this area, a corrective and resting phase of the price began, and a box has formed between this area and the 501 area. The 501 area overlaps with the 0.236 Fibonacci, making it a very important PRZ for BNB.
❌ If you already own BNB, you can set your stop loss if the price consolidates below the 501 area because if this area is broken, the next significant support the price has is the 352 area, which is the most crucial support in this trend and overlaps with the golden Fibonacci area, and a fall to this area could happen.
🛒 For buying in spot, first of all, you must wait until buying volume enters the market so that the price can move upwards. The main trigger for spot is the break of 746, and if this area is broken, the main upward trend can start because the box that the price has built since 2021 will also be broken.
💥 Let’s move to the daily timeframe to analyze the price movement in the short term.
📅 Daily Timeframe
In this timeframe, we also have a range box from 484 to 750, and in this leg, an expanding triangle has formed, which causes the market volatility to increase and the price to show less reaction to static areas.
⭐ On the other hand, because we have a range box and the price is ranging, we can't rely much on indicators and oscillators because they give us incorrect data.
🎲 In this market condition, we shouldn't check too much data and unnecessarily clutter the chart. For a long position, you can enter with the break of the 638 area. It would be better if this break occurs simultaneously or after the triangle break, allowing for more risk.
🔼 The main trigger for buying in spot, as mentioned in the weekly timeframe, is 746, which becomes 750 in this timeframe, and you can proceed with your spot purchase if this area is broken.
📉 For short positions and in general for a bearish scenario, the first trigger is 569, which is a very risky trigger, and in my opinion, we should wait for the price to react to it to be sure of the exact place of this area.
✨ The next triggers are 531 and 484, where 531 is a logical trigger and 484 is the main trigger for a trend change in the large market cycle.
📝 Final Thoughts
This analysis reflects our opinions and is not financial advice.
Share your thoughts in the comments, and don’t forget to share this analysis with your friends! ❤️

BNBUSDT Going Down.Hi there,
BNBUSDT appears bearish on the M30 timeframe, but there is bullish pressure around the 600.59 area. The target is 581.78 if the price manages to break through the bullish pressure (observed on the daily timeframe), with a bias toward 570.
Happy Trading,
K.
Not trading advice

DownI believe we may face war in the future, as the market is on the brink of collapse.
The essence of war often revolves around economic interests or military power.

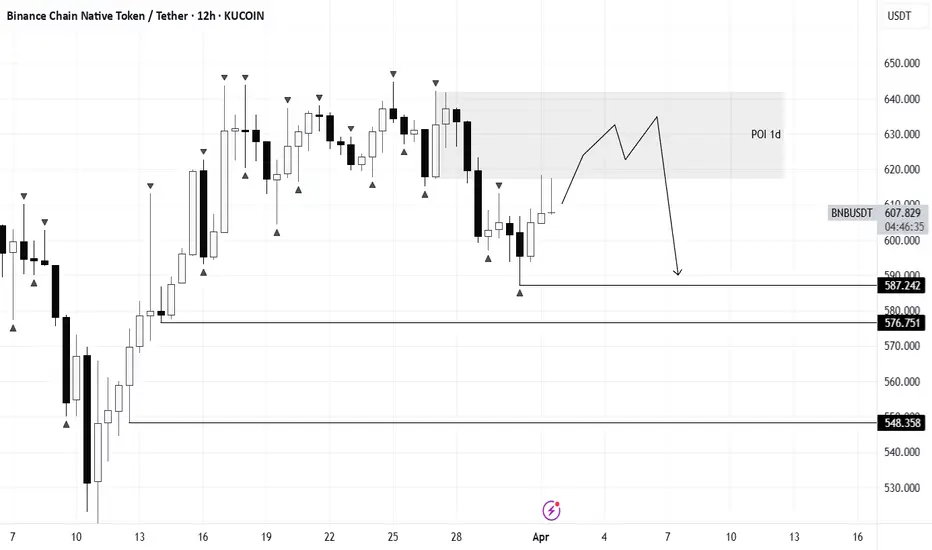
$BNB BNB SHORT. CRYPTOCAP:BNB 12H.
Current dynamics indicates a possible distribution, which opens prospects for medium-term shorts.
Manipulative final upward momentum will create optimal conditions for entry.
Targets: 586.48, 576.32, 567.72, 554.41.

BNB/USDT Price Prediction - 1WTrend Prediction - BNBUSDT Forecasting -
Resistance and Support Lines
It seems that the cup and handle pattern is forming
**** Yousef Sharafi ****
Follow me here for more analysis


BNB/USDTI marked the area from which we can get a reaction. If it is passed, it will act as a support zone.
Target 1 = 587
Target 2 = 576
Target 3 = 548
BNBUSDT | Key Support & Resistance Zones – Trade With PrecisionThe blue box that I gave as resistance 5 days ago gave 8% profit right from the blue box.
Now I think Red Lines has to should be carefully used for shorts.
🔹 %80 Daily Volume Spike – This means we are dealing with a highly active setup, making it one of the most crucial trades of the day. Smart traders focus on high-volume movers, and that’s exactly why we’re here.
Now, I still stand by my analysis and expect the lower blue box below to act as strong support.
🔴 Short Scenario (Red Line Rejections):
✔️ If price rejects from the red lines with LTF breakdowns, I will look for short opportunities.
✔️ CDV & Volume Footprint Confirmations – We need sellers to step in aggressively before considering entries.
✔️ The market respects precision, not emotions. No confirmation = no trade.
🟢 Long Scenario (Regaining Red Lines):
✔️ If price breaks above the red lines with strong volume and successfully retests them as support, I will switch to a long bias.
✔️ LTF Confirmations Are Key – Without a proper reclaim, there’s no reason to rush longs.
Why My Levels Matter
This isn’t just a random setup—my levels are based on deep market insights that most traders don't even understand. That’s why my success rate speaks for itself.
The market is not a guessing game—it’s a battlefield where only the well-prepared win. I provide the roadmap, it’s up to you to execute.
📌I keep my charts clean and simple because I believe clarity leads to better decisions.
📌My approach is built on years of experience and a solid track record. I don’t claim to know it all but I’m confident in my ability to spot high-probability setups.
📌If you would like to learn how to use the heatmap, cumulative volume delta and volume footprint techniques that I use below to determine very accurate demand regions, you can send me a private message. I help anyone who wants it completely free of charge.
🔑I have a long list of my proven technique below:
🎯 ZENUSDT.P: Patience & Profitability | %230 Reaction from the Sniper Entry
🐶 DOGEUSDT.P: Next Move
🎨 RENDERUSDT.P: Opportunity of the Month
💎 ETHUSDT.P: Where to Retrace
🟢 BNBUSDT.P: Potential Surge
📊 BTC Dominance: Reaction Zone
🌊 WAVESUSDT.P: Demand Zone Potential
🟣 UNIUSDT.P: Long-Term Trade
🔵 XRPUSDT.P: Entry Zones
🔗 LINKUSDT.P: Follow The River
📈 BTCUSDT.P: Two Key Demand Zones
🟩 POLUSDT: Bullish Momentum
🌟 PENDLEUSDT.P: Where Opportunity Meets Precision
🔥 BTCUSDT.P: Liquidation of Highly Leveraged Longs
🌊 SOLUSDT.P: SOL's Dip - Your Opportunity
🐸 1000PEPEUSDT.P: Prime Bounce Zone Unlocked
🚀 ETHUSDT.P: Set to Explode - Don't Miss This Game Changer
🤖 IQUSDT: Smart Plan
⚡️ PONDUSDT: A Trade Not Taken Is Better Than a Losing One
💼 STMXUSDT: 2 Buying Areas
🐢 TURBOUSDT: Buy Zones and Buyer Presence
🌍 ICPUSDT.P: Massive Upside Potential | Check the Trade Update For Seeing Results
🟠 IDEXUSDT: Spot Buy Area | %26 Profit if You Trade with MSB
📌 USUALUSDT: Buyers Are Active + %70 Profit in Total
🌟 FORTHUSDT: Sniper Entry +%26 Reaction
🐳 QKCUSDT: Sniper Entry +%57 Reaction
📊 BTC.D: Retest of Key Area Highly Likely
📊 XNOUSDT %80 Reaction with a Simple Blue Box!
📊 BELUSDT Amazing %120 Reaction!
I stopped adding to the list because it's kinda tiring to add 5-10 charts in every move but you can check my profile and see that it goes on..

BNB Breaks Out of Falling Wedge BNB Breaks Out of Falling Wedge
BNB has successfully broken out from the falling wedge pattern, marking a turnaround.
The lowest price was reached at $587.30, and now the bullish momentum is gaining strength again.
A short-term correction might occur near $604, but the price is expected to continue rising afterward.
As shown on the chart, potential targets are $621.50 and $636.50.
You may find more details in the chart!
Thank you and Good Luck!
❤️PS: Please support with a like or comment if you find this analysis useful for your trading day❤️

Bnb is not dead. Its coming backBNB seems to give the bullish reaction first. market coins will rise earlier

BNB/USDT – Bullish Channel Breakout in Play?
#BNB/USDT #Analysis
Description
---------------------------------------------------------------
📉 Pair: BNB/USDT (Binance, 1W Chart)
📊 Analysis by: VectorAlgo
Binance Coin (BNB) has been trading within a well-defined ascending channel, showing strong bullish momentum since mid-2023. The price is currently near the mid-range of the channel and is attempting to push higher.
- Ascending Channel: BNB is trending upwards, respecting both support and resistance levels within this channel.
- Moving Averages: The price is holding above key EMAs, reinforcing bullish sentiment.
- Potential Upside Target: If the trend continues, the next major resistance could be between $900–$1,100.
- Support Levels: If a pullback occurs, watch for support near $500–$550 as a potential buy zone.
Long Entry: Dips into the lower trendline (~$550) could be buying opportunities.
Breakout Play: If BNB clears the mid-channel resistance around $730, a move toward $900+ is likely.
Risk Management: A breakdown below the channel (~$500) could invalidate the bullish setup.
📢 What’s Your Outlook?
Is BNB heading toward new highs, or will we see a deeper pullback? Drop your thoughts below!
---------------------------------------------------------------
Enhance, Trade, Grow
---------------------------------------------------------------
Feel free to share your thoughts and insights. Don't forget to like and follow us for more trading ideas and discussions.
Best Regards,
VectorAlgo

BNB Long (Risky Snipe)Apeing leveraged this areas with tight invalidation.
entry under 628.
bust 624.5 Flat.
A gamble but with Risk Management if bounce we can see a quick Pump.
Note: Not a Financial Advice.

Be careful with BNB !!!the price can form a head and shoulders pattern. If that is happen, expect a significant price increase.
Give me some energy !!
✨We spend hours finding potential opportunities and writing useful ideas, we would be happy if you support us.
Best regards CobraVanguard.💚
_ _ _ _ __ _ _ _ _ _ _ _ _ _ _ _ _ _ _ _ _ _ _ _ _ _ _ _ _ _ _ _
✅Thank you, and for more ideas, hit ❤️Like❤️ and 🌟Follow🌟!
⚠️Things can change...
The markets are always changing and even with all these signals, the market changes tend to be strong and fast!!

BNB - New Higher High is formingBINANCE:BNBUSDT (1W CHART) Technical Analysis Update
BNB is currently trading at $639 and showing overall bullish sentiment. Price is trading inside the channel and new Higher High is expected to formed soon if this bullish trend continues.
Entry level: $639
Stop Loss Level: $
TakeProfit 1: $685
TakeProfit 2: $750
TakeProfit 3: $850
TakeProfit 4: $900
TakeProfit 5: $999
Max Leverage: 2x
Position Size: 1% of capital
Remember to set your stop loss.
Follow our TradingView account for more technical analysis updates. | Like, share, and comment your thoughts.
Cheers
GreenCrypto

BNB DAILYThe analysis you are viewing is on the daily time frame... so it is a long-term view and will give you a clear picture of the trend.
If you liked this analysis, please share it with your friends.

BNBUSDT – Critical Zone: What Happens Next?We are inside a major resistance zone, and the market is at a decision point. This is where most traders get trapped, chasing price without a plan. We don’t trade like amateurs—we trade smart.
📌 Key Levels to Watch:
🔵 Lower Blue Box = Strong Support – If price drops, this is where buyers may step in. No panic, just opportunity.
🔴 Current Resistance Zone – If we break out with volume and retest cleanly, we enter long with conviction.
📉 If Sellers Take Control – No problem. A rejection with LTF breakdowns gives us a high-probability short trade.
💡 The Difference Between Winning & Losing? Discipline.
This is why you need to follow me. I don’t chase, I don’t FOMO, I trade with precision, and that’s why I win. You can keep gambling, or you can trade with an edge. Your call.
📌I keep my charts clean and simple because I believe clarity leads to better decisions.
📌My approach is built on years of experience and a solid track record. I don’t claim to know it all but I’m confident in my ability to spot high-probability setups.
📌If you would like to learn how to use the heatmap, cumulative volume delta and volume footprint techniques that I use below to determine very accurate demand regions, you can send me a private message. I help anyone who wants it completely free of charge.
🔑I have a long list of my proven technique below:
🎯 ZENUSDT.P: Patience & Profitability | %230 Reaction from the Sniper Entry
🐶 DOGEUSDT.P: Next Move
🎨 RENDERUSDT.P: Opportunity of the Month
💎 ETHUSDT.P: Where to Retrace
🟢 BNBUSDT.P: Potential Surge
📊 BTC Dominance: Reaction Zone
🌊 WAVESUSDT.P: Demand Zone Potential
🟣 UNIUSDT.P: Long-Term Trade
🔵 XRPUSDT.P: Entry Zones
🔗 LINKUSDT.P: Follow The River
📈 BTCUSDT.P: Two Key Demand Zones
🟩 POLUSDT: Bullish Momentum
🌟 PENDLEUSDT.P: Where Opportunity Meets Precision
🔥 BTCUSDT.P: Liquidation of Highly Leveraged Longs
🌊 SOLUSDT.P: SOL's Dip - Your Opportunity
🐸 1000PEPEUSDT.P: Prime Bounce Zone Unlocked
🚀 ETHUSDT.P: Set to Explode - Don't Miss This Game Changer
🤖 IQUSDT: Smart Plan
⚡️ PONDUSDT: A Trade Not Taken Is Better Than a Losing One
💼 STMXUSDT: 2 Buying Areas
🐢 TURBOUSDT: Buy Zones and Buyer Presence
🌍 ICPUSDT.P: Massive Upside Potential | Check the Trade Update For Seeing Results
🟠 IDEXUSDT: Spot Buy Area | %26 Profit if You Trade with MSB
📌 USUALUSDT: Buyers Are Active + %70 Profit in Total
🌟 FORTHUSDT: Sniper Entry +%26 Reaction
🐳 QKCUSDT: Sniper Entry +%57 Reaction
📊 BTC.D: Retest of Key Area Highly Likely
📊 XNOUSDT %80 Reaction with a Simple Blue Box!
📊 BELUSDT Amazing %120 Reaction!
I stopped adding to the list because it's kinda tiring to add 5-10 charts in every move but you can check my profile and see that it goes on..
BNB: Poised to Resume Bullish TrendBNB Poised to Resume Bullish Trend
Since February 13, BNB has experienced a month-long decline, entering a clear 4-hour bearish trend. However, the price appears to have completed a "Descending Channel" pattern, signaling a potential shift.
Currently, BNB is demonstrating renewed strength. A decisive move above the descending channel could propel BNB upwards, with an initial target of 625 and a secondary target of 670.
You may watch the analysis for further details!
Thank you:)

BNB: Navigating the Current DipBNB: Navigating the Current Dip 📉🔍
The crypto market is always in flux, and right now, BNB is showing signs of a downward trend. However, it's not all doom and gloom. Let's break down the situation.
The Current Scenario 📉:
BNB is currently experiencing a downward trajectory. Despite this, it's crucial to acknowledge that the coin has maintained a pattern of higher lows and higher highs. This suggests that the current dip might be a temporary sideways correction before BNB aims for the $650 mark in the near future.
Key Technical Analysis 📊:
Fibonacci Levels: BNB is currently within the Fibonacci retracement levels of $629.7 to $638.6. These levels are significant indicators of potential support and resistance.
Support and Resistance:
A strong support level has been observed at $630.9.
Potential resistance is identified at $637.2.
Statistical Analysis: This analysis is based on robust statistical modeling, specifically the VAR (Vector Autoregression) model, which helps in understanding the interdependencies between multiple time series data. This adds a layer of reliability to the prediction.
Understanding the Trends 🤔:
The fact that BNB is maintaining the pattern of higher lows and higher highs indicates that the overall bullish trend might still be intact. The current dip could be a temporary phase of consolidation before the next upward surge.
The $650 Target 🎯:
The analyst predicts that BNB is likely to aim for the $650 price point in the near term. This prediction is based on the analysis of current trends and historical data.
The Next 12 Hours ⏳:
The next 12 hours are critical. We'll be closely monitoring how BNB interacts with the identified support and resistance levels. Any significant break above or below these levels could indicate the direction of the next major move.
Important Considerations ⚠️:
The crypto market is highly volatile.
Always conduct your own research before making any investment decisions.
Market fluctuations are possible.
In Conclusion 🌟:
While BNB is currently on a downward trend, the overall outlook remains cautiously optimistic. The identified support and resistance levels, combined with the statistical analysis, provide valuable insights into potential future movements. Let's keep a close eye on BNB in the next 12 hours to see how things unfold.
I hope this breakdown provides a clear picture of the current BNB situation! 🚀
What do you think, friends?

Magic of statistical models and mathematics Hey everyone! 👋 I wanted to share some of the magic of statistical models and mathematics with you. ✨ Check out how price reacts to Fibonacci levels, those levels are determined by using the VAR statistical model. 📊
It's amazing how numbers and patterns can reveal hidden insights in the market! It's like watching a secret code unfold right before our eyes. 🤩 The way price respects those Fibonacci levels is truly fascinating. It's a testament to the power of these models and the beauty of mathematics. 🤓
Enjoy the show! 🍿

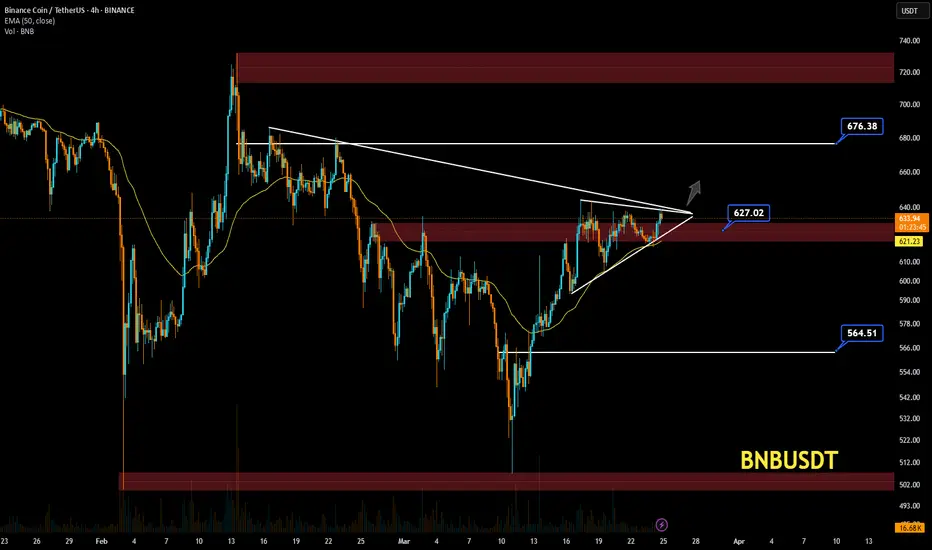
BNBUSD BNBUSD Price Action Analysis – 4H Timeframe 📊🔥
Market Structure:
The chart shows a symmetrical triangle pattern forming, with the price approaching a breakout. 📈🔺
Supply and demand zones are marked with red boxes, indicating key levels for reaction. 🟥
The price is currently testing the $627.02 resistance level. 🚀
Trend Analysis:
A Higher Low (HL) was recently formed at $564.51, maintaining the bullish trend. 🔼
The 50 EMA at $621.21 acts as a strong dynamic support. 📉
Increasing volume suggests a potential breakout. 📊
Key Levels:
Resistance:
The $627.02 - $630 area is a critical supply zone. If broken, the next target would be $676.38. 🎯
A breakout above this level could confirm strong bullish momentum. 🟢
Support:
The $621.21 level, aligning with the 50 EMA, serves as a key support. 📉
If this level breaks, a potential decline toward $564.51 is possible. ⚠️
Possible Scenarios:
🔹 Bullish Case: A confirmed breakout above $627 could push the price toward $676. 🚀
🔹 Bearish Case: Rejection from resistance and a break below $621 may lead to a drop to $564. ❌
📌 Conclusion:
Watching for breakout confirmation before making any decisions. 🔎
Key levels: $627 (resistance) and $621 (support). 📍
Volume and price action will determine the next move. 📊