bnbusdt daily signalHello, we came with the analysis of the currency bnb, as you can see, the currency bnb is in a very good situation, if it can break upwards, it can grow very well, even breaking its historical ceiling.
BNBUSDT.3S trade ideas

bnbusdt daily signalHello, we came with the analysis of the currency bnb, as you can see, the currency bnb is in a very good situation, if it can break upwards, it can grow very well, even breaking its historical ceiling.

Testing the bottom of the ascending triangleIn the daily chart of BNB, it is observed that the price is testing the bottom of the ascending triangle formed at the price range of $580.
The significant resistance level is at $632, which, if broken, can be seen as an indication of the continuation of the upward trend. Breaking the support level at $580 could lead to a further decline in price to lower levels.

Binance Coin Price Pattern Set for Breakout is $900 Inevitable?The native coin of the crypto currency exchange Binance ( CRYPTOCAP:BNB ) price has been in a close consolidation phase for nearly 13 weeks. With each passing daily candlestick close, CRYPTOCAP:BNB gets squeezed more, suggesting a steady decline in volatility. These types of continuous consolidation in price actions are usually followed by a massive breakout, and that’s what awaits $BNB.
Binance Native Coin CRYPTOCAP:BNB price Sets for Breakout
Binance Coin price spike up 63% between March 6 and 16, setting up a local top at $646. This impressive uptrend, which only took CRYPTOCAP:BNB ten days to go from $394 to $646, was followed by a consolidative phase that exists as of Saturday.
Despite the price action from March 6 to June 1 shows the formation of a bullish continuation pattern known as a "Bullish Pennant". The aforementioned 63% rally is the flag pole, and the sideways movement that produced lower highs and higher lows is the pennant.
The forecast for this setup is determined by adding the flag pole's height to the breakout point. In Binance Coin’s case, assuming the breakout occurs at $616, the flag pole’s height shows that the Bullish Pennant target for BNB is $900. This ambitious target is roughly 45% away from the all-time high of $692.90.
However, if the market outlook worsens, sending Bitcoin ( CRYPTOCAP:BTC ) price down to $60,000, then it could disrupt the Binance Coin ( CRYPTOCAP:BNB ) price movement, leading to a bearish breakout. This move would invalidate the bullish pennant pattern. In such a case, CRYPTOCAP:BNB could slide 9% and retest the $526 support level. A daily candlestick close that flips this support into a resistance level, would validate the potential start of a downtrend.

$BNB #Binance Trading IdeaBNB/USD (Binance) price for the past 2 weeks still squeezing inside this ascending triangle pattern. Full send to its ATH after a breakout.

BNB Massively Undervalued? $10,000 Potential!BNB has been making some extraordinary moves last cycle, where it bottomed around $4.5 and made it to $700 during the next top.
Looking at the chart, we can clearly see that BNB follows a bullish channel pattern. My assumption is that this channel will hold and that BNB will make a move towards the top of the channel.
$10,000 is possible, it's a "mere" +5,000% move from bottom to top, as opposed to last cycle's +16,000%.
Are you bullish on BNB? Share your thoughts.

BNB consolidating support?Greetings! BNB action has been under selling pressure since the previous reach to the 630s. Lower pivot which served as support from the first leg of the fall is now located around the 591 level. Getting that level conquered, allows the price to rally up to the higher levels depicted in chart, the very first one win is the midrange wave which sits above the 600. This report concludes with a short-term bullish forecast to be invalidated below 580. With a nice accumulation range from 590 to 585 that can be distributed above 605.

BNBHello
Bnb chart is looking really good , in case of upside breakout targeted price is 1100$ with a small stop in 750$
Are you bullish or bearish on BNB here ?

BNBUSDT ready for a breakouthi traders,
Let's take a look at BNBUSDT on 1D time frame.
It looks like we're going to get a breakout in the next few days.
RSI in a neutral zone.
Enter the log position once we get a successful breakout.
Target: 772 $
Good luck


BNB - potentially getting out of the triangleA nice setup is currently being created on BNB. The upside exit from the triangle I marked should give a strong upward impulse. Entering riskier positions at the bottom of the triangle trend line with a fate stop below the last lows (worth the risk) or safely after a retest of exiting the triangle at the top. In both cases we are targeting the same TP of 1.618 measuring the fibo of the last correction:
TP - around $730
The negation of this analysis would be the formation of a lower low on the H4 time frame.

BNB: Potential Bull Pennant Breakout!Hey everyone! If you enjoy this content, please consider giving it a thumbs up and following for more analysis.
BNB recently completed a formation resembling a bull pennant pattern on the daily timeframe. The price has broken out of this pattern and is currently retesting the breakout zone. If it holds this retest level, it could signal further bullish momentum for BNB.
Buy some now and add more in the dip.
Entry range:- $560-$600
Targets:- $712/$834/$986/$1194
SL:- Daily close below $530
Let's Discuss!
What are your thoughts on BNB's current price action? Do you see a bullish pattern? Share your analysis in the comments below!

My BNB plan for the next couple of weeksMy BNB plan for the next couple of weeks
If a breakout happens, we could see a $1000 target!
But be cautious: if it breaks down below $575, we might see $400 levels.

ALT COIN Explosion incomingBullish on All ALTS, post halving, altcoins also explode to the upside, they are gearing up

BNBUSDT long Potential trajectory towards 661.5, there is also a retest. In the meantime, a strong bullish candl

BNB WILL BREAK $700BNB is in a strong bullish momentum and the chart is showing us a good bullish pattern. We can see the price has broken out from daily resistance trendline and it's performing a nice retest of it. I expect a little range there before another pump that could lead the price above $700, that's the next resistance area where we could see a pullback


BNB - long opportunityBNB went down after breaking traingle with bullish move so wait for bullish momentum after filling gab and reach OB to hunt long opportunity

BNB: Sideways ChannelTrade setup : Price remains in an Uptrend, however, it’s consolidating in a Sideways Channel ($500 - $620). Price has been very strong lately relative to the market. Most altcoins are off their March highs by 30-50% and this one keeps pushing against the $620 resistance...seems it`s just a matter of days before it pierces through and marches higher. Swing traders : can enter near channel support of $500 and exit near horizontal resistance of $600 for a +20% gain. Stop Loss (SL) level at $470. Trend traders : wait for a breakout.
Pattern : Price is trading in a Sideways Channel , which is a neutral pattern (indication of market indecision). Trend Traders ought to wait for a breakout in either direction, although typically it breaks in the direction of the existing trend. Swing Traders can trade the range? Buy near Support and Sell near Resistance. Learn to trade Sideways Channel in Lesson 6.
Trend : Short-term trend is Strong Up, Medium-term trend is Up and Long-term trend is Strong Up.
Momentum is Bullish (MACD Line crossed above MACD Signal Line). Price is neither overbought nor oversold currently, based on RSI-14 levels (RSI > 30 and RSI < 70).
Support and Resistance : Nearest Support Zone is $500.00, then $400.00. Nearest Resistance Zone is $670.00.

Why BNB will Break Above $4,000: A Technical Analysis BNB, the native token of the Binance blockchain ecosystem, has been exhibiting remarkable strength and resilience amidst the recent market downturn. While the overall cryptocurrency market has experienced significant volatility, BNB has held its ground and demonstrated a strong potential for continued growth. This article delves into the technical and fundamental factors that support BNB's bullish outlook and suggest its price could surpass $4,000 in the coming months.
Technical Analysis:
Daily Timeframe:
BNB has consistently formed bullish triangles on the daily timeframe, breaking out of each pattern with upward momentum. The most recent breakout propelled BNB from $300 to $600, marking a remarkable 100% gain. This pattern suggests that BNB is poised for another significant upward move.
Weekly Timeframe:
Currently, BNB is trading within a horizontal accumulation pattern on the weekly timeframe, a consolidation phase that has lasted for over 1,000 days. However, within this larger consolidation, BNB has established a tighter trading range, creating a spring-like effect. This pattern suggests that a breakout from the horizontal range and a surge towards $5,000 could be imminent.
Monthly Timeframe:
On the monthly timeframe, BNB has never exhibited bearish sentiment, consistently trading within an ascending channel. This uptrend has been further reinforced by a recent retest of the lower channel boundary, demonstrating strong support and a continuation of the uptrend.
Fundamental Factors:
Binance Ecosystem Growth:
The Binance ecosystem has experienced tremendous growth in recent years, expanding its services, user base, and transaction volume. This growth has directly benefited BNB, increasing its utility and demand.
BNB Burning Mechanism:
Binance regularly burns significant amounts of BNB through its buyback and burn program. This mechanism reduces the circulating supply of BNB, creating scarcity and driving up its price.
Staking Rewards:
BNB holders can earn attractive staking rewards by locking up their tokens and participating in various validation nodes. These rewards further enhance the token's value and incentivize long-term holding.
Inflation Resistance:
Unlike fiat currencies, BNB's supply is capped, making it inherently resistant to inflation. This characteristic positions BNB as a hedge against inflation and a store of value.
Conclusion:
BNB's technical analysis and fundamental factors paint a compelling picture of a token poised for significant growth. The consistent bullish patterns, strong ecosystem growth, token burning mechanism, staking rewards, and inflation resistance all contribute to BNB's bullish outlook. While market conditions can always change, the weight of evidence suggests that BNB has the potential to break above $4,000 and continue its upward trajectory.

BNBUSD 1DBNB ~ Updated
#BNB Finally managed to break the resistance line of this pattern, A retest is expected from here, to continue the rise.

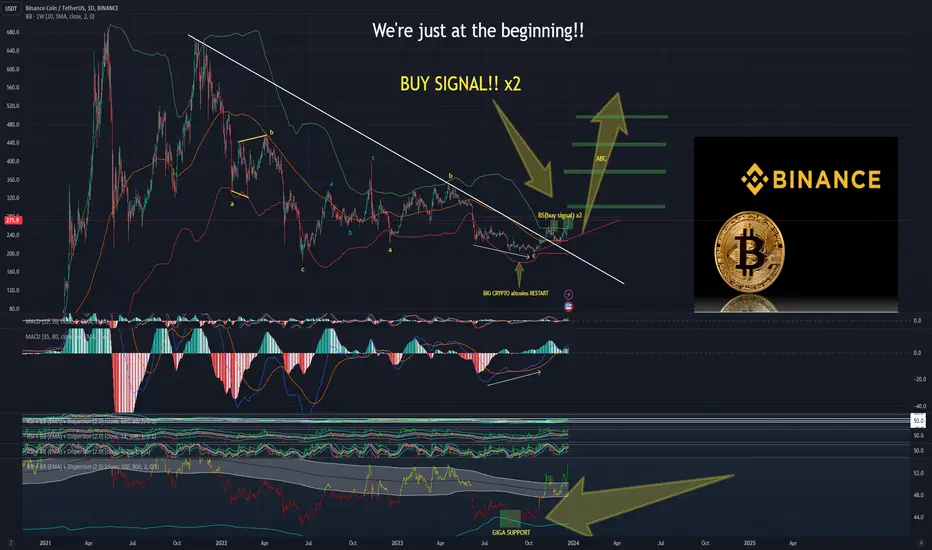
BNB coin is just getting started!! BULLISH!!BNB value will not drop below 200$ anymore, don't get your hopes up if you are waiting for it.
The news has been bad but BNB coin has the green light!!!!. I noticed that the news turned the volume down, but the wave theory is fine.
CZ is an interesting and smart character to me and I don't condemn his actions. Do what you want, the main thing is not to get caught, but this time it was different with him. The fact that the investigation proved his wrongdoing and that he stepped down as CEO makes sense for the future of Binance.
Generally BULLISH.
The analysis is very likely considering BITCOIN, on the MD channel you can find BTC analysis which I update often, I have been successful with it.
My personal home crypto exchange is Binance. MoralDisciple
LONGBNBUSDTjust now
I think it has no intention of going down and wants to continue its ascent and as I have specified in the chart, it is possible to go to higher prices.
Let's see what happens
