BNBUSDT.P trade ideas


BNB Scalp ShortBnb is following BTC and falling, currently hovering around 0.618,
I think it will fall to around 581-580, there are a lot of warrants,
and if price leave the tunnel pattern, it will fall down

BNB ANALYSIS🚀#BNB Analysis :
🔮As we can see in the chart of #BNB that there is a formation of Descending Channel Pattern. #BNB is consolidating in a descending channel.... currently waiting for breakout the pattern. It is trading above its major support zone and there maybe a small retest towards support zone and after that we will see a bullish move📈📈
🔰Current Price: $589.2
🎯 Target Price: $602.8
⚡️What to do ?
👀Keep an eye on #BNB price action. We can trade according to the chart and make some profits⚡️⚡️
#BNB #Cryptocurrency #TechnicalAnalysis #DYOR

Binance Coin (BNB): Looking For Rejection of ResistanceBinance Coin is looking pushy after that fakeout near 200EMA. As of now, the price is trading still below the major resistance zone in a 4-hour timeframe, where we do not see any signs of a breakout (of a fakeout).
But what caught our attention is the price being stuck between the 100 EMA and the resistance zone, where the price is under huge pressure from both buyers and sellers.
We are looking more into that 100EMA to be broken so keep an eye on that zone there. If we see a break, we will see another movement to 200EMA; if not, a possible breakout can still happen!
Swallow Team

BNBUSDT BINANCE 1W-TIMEFRAME ANALYSIS💥BNBUSDT BINANCE 1W-TIMEFRAME ANALYSIS
💗Hello ladies and gentlemen
This is my new idea for 💥BNB BINANCE
I hope my idea is clear
Support me by like and share thank you
Stay Safe💯💲💲💲
Good luck💰😍


Key Resistance and Bearish SignalsKey Factors Influencing BNB Price
1. Technical Indicators and Their Implications:
The MACD is neutral, but the histogram at -1.5 and the MACD line at -1.7 indicate slight bearish momentum, suggesting caution.
With %K at 21.02 and %D at 23.04, the Stochastic Oscillator indicates oversold conditions, suggesting a potential for a short-term rebound.
The RSI is at 40.48, indicating that BNB is in a bearish zone, but not yet extremely oversold.
2. Price Trends and Resistance Levels:
Potential Market Scenarios
Bullish Scenario:
A break above the local resistance at $594.4 could lead to further upward movement, potentially targeting the dynamic resistance around $593.5 and beyond.
Bearish Scenario:
If BNB fails to break above the local resistance, it could retest the support levels at $569.2 and potentially fall to the dynamic support level at $573.1. A break below $569.2 could signal further declines.
Conclusion and Market Outlook
BNB is currently positioned with significant support and resistance levels to watch. The neutral MACD and overall market activity suggest caution, as the potential for bearish movement exists. Monitoring the key resistance levels and potential support levels is crucial for making informed trading decisions.

$BNB chart looks bearishIn my previous posts, i' ve revealed the weakened chart of #binance coin, #BNB . The structure is weakening day by day. May be there' ll be a relief rally or some bounces but the main idea is: #bnbusd needs a heavy correction in mid term.

Trade Setup: BNB Long PositionMarket Context:
BNB started the week above the weekly pivot, with an inside pivot pattern that often leads to explosive moves.
The trade focuses on entering near the pivot at a support zone, with a strategy to move the stop loss to break even if the price moves 2-4% from entry to prevent losses from manipulation.
Trade Parameters:
Entry: Enter a trade between $580.55 - $576.55.
Take Profit:
First target: $605.25
Second target: $633.05
Stop Loss: Set at a candle close under $572.90
Risk Management:
If the price moves 2-4% from the entry point, move the stop loss to break even to manage risk effectively.
📊 Monitor the price action and adjust your trade based on market conditions. Prioritize risk management and be cautious of any signs of reversal or manipulation. #BNB #CryptoTrading #TradeSetup 🎯

BNB super pump to $605...todayjust entered bnb long.
Target $603.7 and higher.
#bnbusdt #bnbusd
I anticipate a big rally pump today to try and make a higher high on the daily tf and I think this is the new potential hl low that just formed given the volume and bullish price action in this area.
Roughly 6 RR trade

BNBUSDT.1DIn my detailed technical analysis of the BNB/USDT chart, I've assessed the price movements and identified several critical technical indicators that provide a clear picture of Binance Coin's current trading environment and its potential future trajectory.
Technical Overview:
As of the latest data, BNB is trading around $584.9. It's up slightly by 0.69% on the day, with the chart showing a resilient uptrend over the past few months, highlighted by the ascending trendline.
Key Technical Indicators:
Support Levels:
S1 ($498.1): This level has provided strong support throughout recent price movements. The price rebounding off this level has reaffirmed its significance as a strong base for BNB.
S2 ($359.5): This level is much lower and would likely come into play only in a significant market downturn.
Resistance Levels:
R1 ($644.8): This is the immediate resistance level facing BNB. It has acted as a stiff resistance point recently, with the price failing to break and hold above this level multiple times.
Moving Average Convergence Divergence (MACD):
The MACD line is above the signal line but very close, indicating a potential cooling off of the bullish momentum. However, the histogram is still in positive territory, suggesting that the upward trend might still have some energy left.
Relative Strength Index (RSI):
The RSI is at 55.03, which is neither in the overbought nor oversold territory. This suggests a balanced market sentiment with potential for either direction, though it leans slightly towards bullish sentiment without immediate risk of reversal.
Chart Patterns:
The ascending trendline from the lows of early 2024 acts as a dynamic support, guiding the uptrend. This trendline is critical; as long as the price remains above this line, the bullish outlook remains valid.
Conclusion:
The current setup in the BNB/USDT pair is cautiously optimistic. The maintenance of price above the ascending trendline and S1 at $498.1 is pivotal for sustaining bullish momentum. My focus will be on the $644.8 resistance level. A decisive breakout above this level could propel BNB towards new highs, potentially retesting the all-time high near $721.8.
Given the current market conditions, traders should consider a strategy that allows for flexibility in response to price actions near these key levels. Setting stop losses slightly below S1 could help mitigate risks in case of sudden bearish reversals. As always, staying updated with any broader market news or changes in crypto regulations is crucial for adjusting strategies promptly.

Long trade
Sat 27th Juky 24
Buyside trade
LND to NY Session
Entry 588.58
Profit level 603.92 (2.61%)
Stop level 585.65 (0.50%)
RR 5.24
Observed (trending inside th range)
Whykoff

Binance Will PumpThe chart says it all if you know were to look, it's truly that simple.
The fundamentals are the same, but the technicals are leading this one.
Use stops, be safe.

BNB-USDT 1D Hello everyone, I invite you to review the BNB to USDT chart on a one-day time frame. As we can see, the lines of the main upward trend and the downward trend intersect, creating a triangle in which the BNB price remains.
Let's move on to determining support and here, after decomposing the FibRetracement tool, we see support at $548, then we have strong support at $513, and then very strong support at $455.
Looking the other way, we will define the resistances in a similar way and here we can see how the price has approached a very strong resistance around $620, only when we manage to go up from it we will be able to see an increase to around $723.

Bear Flag : Short Position- Break out from ascending channel
- Divergence on MACD
- Pull back happened.
Looks like a potentially good short to me.

BNBFocus on Downside , wait for small timeframe retest then goes to proper Entry First Target 6 to 7%

BNBUSTdaily chart
SELL
TP: 567
The daily candle closed under 587 then the the indicator is sell and the tp is 567

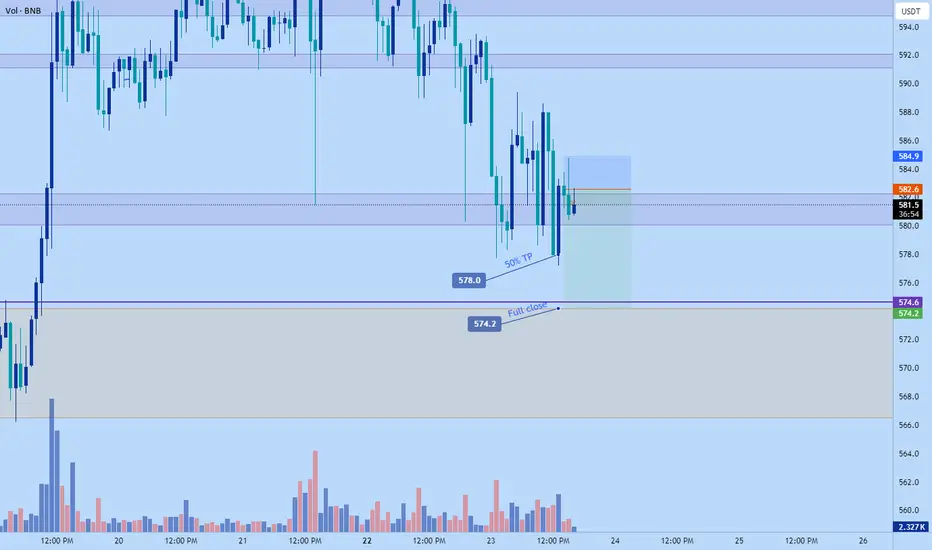
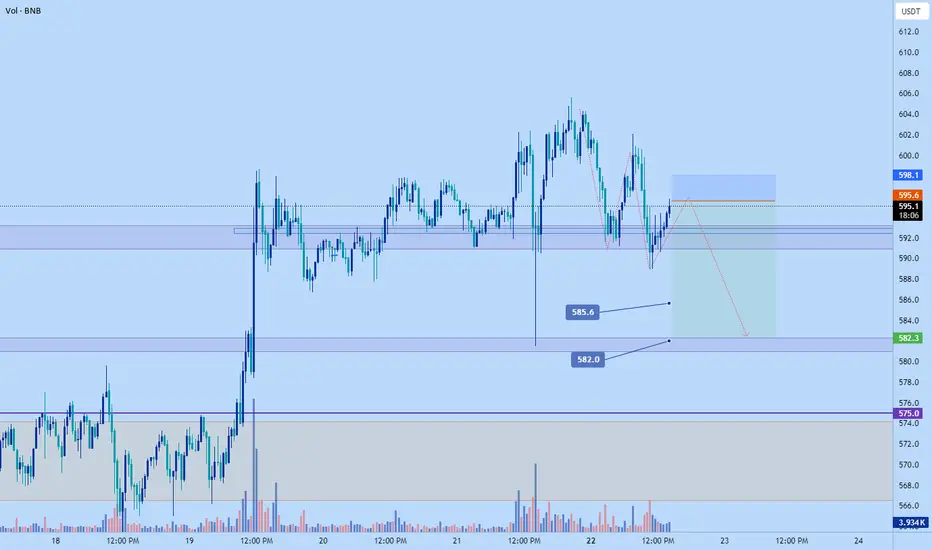
BNB to collapse to $582...today!Targets for #BNB Short
Tp 1 🎯$585.6 -- 50% 💵
Tp 3 🎯$582 -- close 💵
(I'll only take partial at TP 1 if the market is hesitating to drop lower, main target is $582. Also I keep my targets open unless am going to bed or if I will be away because sometimes the market can flush drop or pump aggressively and you can make a lot more profit than if you have fix targets set)
Right now I'm just waiting for entry signal in the optimal time period after I see signs of whales entering the market. I don't trade bnb often, its kinda weird with the tick movement but it's a beautiful setup, with potential 4-5RR move.
So I haven't entered the trade as yet, just sharing just incase anyone reading want to follow along and have enough time to prepare . I'll comment on the post when I enter... if I enter so you probable need to follow to get notified.
$BNB will hold the support?#binance coin #bnb is sitting on the trend support. After the bounce at 54K, #bnbusd is moving in ascending channel. A bearish divergence has been formed in lower time frame. Breaking this support will be dangerous. Price must hold it to be bullish. Not financial advice.

Will BNBUSDT Crash Through Support? Key Levels You Can't Miss!Yello, Paradisers! Have you been keeping an eye on Binance Coin (#BNB)? Our latest analysis suggests a critical moment is approaching. Let’s dive into the details.
💎#BNBUSDT has been trading within a symmetrical triangle pattern on the 1D timeframe. Previously, We've observed a failed breakout which reinforces a bearish bias. Currently, #BinanceCoin is retesting the symmetrical triangle's lower support level, and there is a possibility that it might drop further.
💎The diminishing trading volume and POC of VRVP acting as resistance increases the chances of further drop. If #BNB fails to hold the support at the symmetrical triangle's lower boundary, it's likely to retest the Bullish Order Block (OB) around $460.3.
💎However, if CRYPTOCAP:BNB fails to hold at $460.3, the next support level to watch is at $422.9. This area is packed with liquidity and can create a good chance of pullback if tested.
💎On the contrary, If the symmetrical triangle's lower support level holds well, we could see the bulls taking control, leading to a bullish rally. The overall market sentiment and Bitcoin's movement will significantly influence #BNB's price action, so keep a close eye on these factors.
If you want to be consistently profitable, you need to be extremely patient and always wait for high-probability trading opportunities.
MyCryptoParadise
iFeel the success🌴

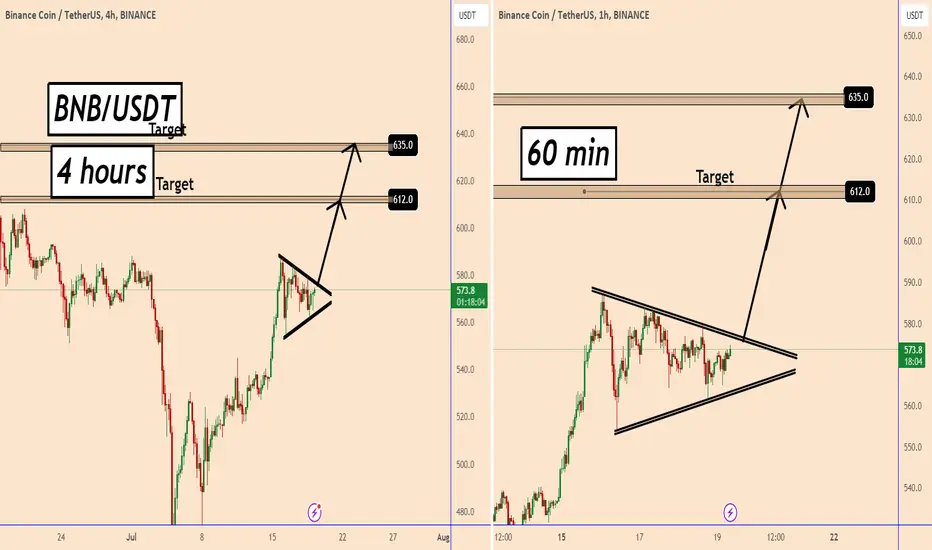
BNB Consolidating Inside a Triangle Patter, Bulls in ControlBNB Consolidating Inside a Triangle Patter, Bulls in Control
Price Analysis:
The price is developing a triangle pattern which is showing the possibility for a bigger bullish movement.
In the 4-hour chart the price faces a strong resistance near 590 but after this bullish accumulation, we should see BNB resuming the bullish trend again.
For this reason, we have to wait for the price to break out of the triangle shown on the 60 min chart.
BNB may rise to 612 and 635 after the bullish breakout.
You may find more details in the chart!
Thank you and Good Luck!
❤️PS: Please support with a like or comment if you find this analysis useful for your trading day❤️