An Example of Trading a Coin (Token) You're Hesitant to Trade
Hello, fellow traders!
By "Following," you'll always get the latest information quickly. Have a great day today.
-------------------------------------
There are coins (tokens) that are showing positive trends, but are reluctant to trade.
BNB and TRX are two such coins.
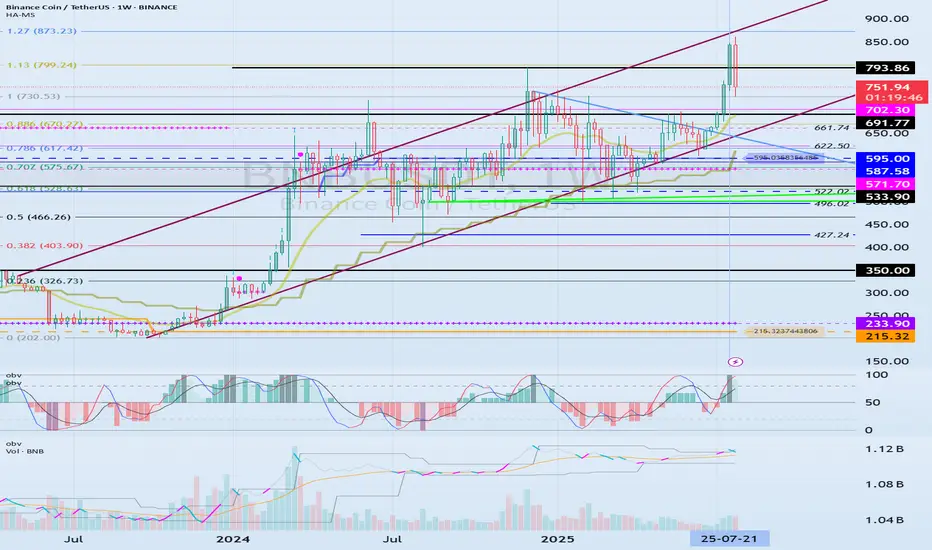
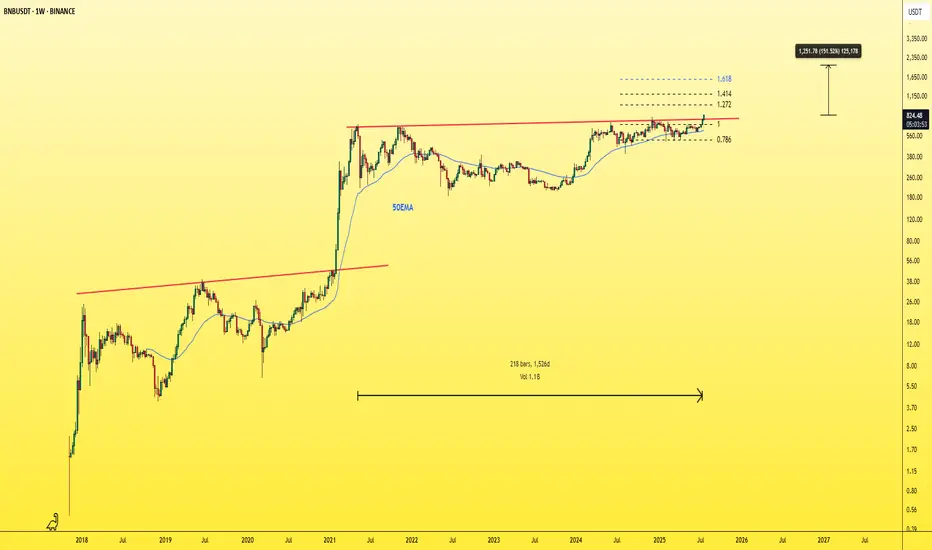
(BNBUSDT 1W chart)
(TRXUSDT 1W chart)
What these two coins have in common is that their representatives are Chinese.
These two coins are consistently making efforts to expand globally.
BNB is ranked first among exchange-traded coins, while TRX is steadily making efforts to expand into the US market to expand globally.
Despite this, some are reluctant to trade due to concerns about being an exchange-traded coin and being a Chinese coin.
To mitigate this risk, it's best to increase the number of coins (tokens) that ultimately generate profits.
In other words, by selling the amount of the original purchase price, you retain the number of coins (tokens) that represent profit.
This way, even if the price plummets, you'll always be in profit, allowing you to seize new opportunities.
For coins (tokens) that demonstrate long-term growth potential, increasing the number of coins (tokens) that represent profit is recommended. While these coins (tokens) appear to have potential for long-term growth, they currently carry some risk.
This also applies to coins that are considered worth holding for the long term, such as BTC and ETH.
Therefore, coins (tokens) that have a large user base and are considered to have future value, such as XRP, ADA, SOL, and DOGE, still carry some risk.
-
Thank you for reading to the end.
I wish you a successful trading experience.
--------------------------------------------------
BNBUSDT trade ideas
DeGRAM | BNBUSD held the support line📊 Technical Analysis
● BNBUSD rebounded from the purple rising support line and is now forming higher lows above the 750 support, aligning with the long-term channel base.
● The price structure suggests a bullish continuation toward 808.5 and 847.3 if price holds above 750, with a zigzag consolidation pattern indicating controlled accumulation.
💡 Fundamental Analysis
● Rising user activity and new project launches on BNB Chain continue to attract liquidity, while Binance's recent compliance wins restore investor confidence.
✨ Summary
Buy 755–765; hold >750 targets 808.5 → 847.3. Setup invalidated on daily close <735.
-------------------
Share your opinion in the comments and support the idea with a like. Thanks for your support!

BNBUSDT 4H Review🔍 Technical Structure
📉 Descending Channel (orange lines)
The price was moving in a clear downtrend within the channel.
A breakout from the channel to the top occurred, which is a potentially bullish signal.
The price is currently testing a level above the channel—a classic retarget (retest) of the breakout.
🟩 Support/Resistance Levels (green and red lines)
✅ Support:
760.97 USDT – currently tested as support after the breakout from the channel.
739.81 USDT – local support, previous resistance.
717.89 USDT – stronger support, lower boundary of the channel.
❌ Resistance:
779.87 USDT – short-term resistance.
809.72 USDT – key resistance on the higher timeframes.
📊 Volume
Volume increased during the breakout from the channel, supporting its credibility.
It is currently declining slightly, which may suggest consolidation or waiting for another impulse.
🔄 Stoch RSI Oscillator (at the bottom of the chart)
Currently leaving the overbought zone (>80) and heading down.
Potential bearish or consolidation signal for the coming sessions.
🧠 Scenarios
1. Bullish Scenario (continuation of the breakout):
If the 760.97 level holds as support,
A move to 779.87 is possible, followed by a test of 809.72.
2. Bearish Scenario (false breakout):
If the price falls below 760.97 and fails to stay above 739.81,
A retest of 717.89 or even a return to the descending channel is possible.
📌 Conclusions
Currently, the key level is 760.97 USDT – maintaining it will confirm the bulls' strength.
Oscillators suggest a possible correction or consolidation.
For a long position: a good place to test 760.97 with a narrow SL below 739.81.
For a short position: a potential signal if 760.97 is not maintained.

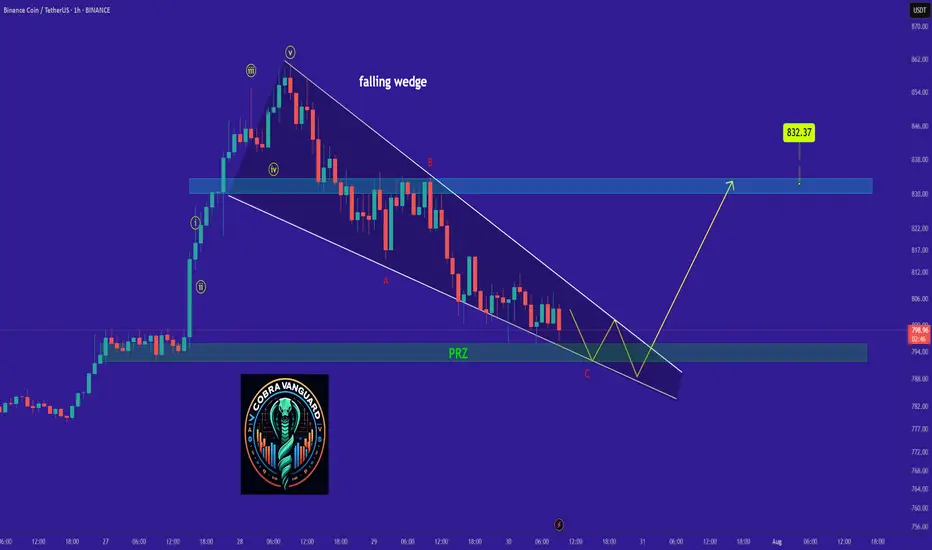
BNB's Situation (1h) !!!The BNB is in a Bullish phase by a Falling Wedge Pattern.
A falling wedge indicates the potential for price to reach to $830.
Note if the PRZ ZONE is broken downwards with the strength of Bearish candles , this analysis of ours will be failed.
Best regards CobraVanguard.💚
BNB - the strangest coin on the market? Almost no one trades it, and volumes have been falling for the second year in a row. But at the same time, it is the only token on the market that is in an upward flag. It is showing an even stronger trend than Bitcoin.
Yes, we are talking about BNB. Here's why you should pay attention to this token:
➡️ Money Flow shows divergence with the price, positions continue to close, and liquidity is gradually disappearing. However, over the past year and a half, the token's liquidity has hardly ever been in the negative zone.
Meanwhile, Bitcoin spent months in this zone, reaching values of -0.20. BNB barely touched the negative zone and immediately rebounded. This speaks to people's crazy faith in the token. There are simply no sellers.
➡️ Volume - purchase volumes have also diverged and continue to decline. BNB reached its current ATH on negligible volumes, which again highlights the complete lack of sellers. Even now, at the new ATH.
➡️ Liquidity Depth - as we know, the price moves from liquidity to liquidity. And now it is dozens of times greater at the bottom than at the top. This potentially hints at a local correction.
Also, during the growth, a GAP formed at the level of $576 - $502. And as we know, 99% of GAPs close sooner or later. But there is only one GAP and it is small, since BNB is a fairly low-volatility token and is traded quite effectively on its way up.
➡️ It is also the only one of the market leaders currently in an ascending flag, which means that the token has not yet seen a correction.
📌 Conclusion:
The chart looks obviously great, but there is local overheating, which will definitely be removed sooner or later. So BNB looks promising for shorting if it does not hold at $796.
However, Binance is certainly doing an excellent job of promoting its token with all these Launchpads and so on. So it is worth looking at a major correction to build up a spot position in BNB.
Subscribe and stay tune with more impactful ideas on trend tokens!

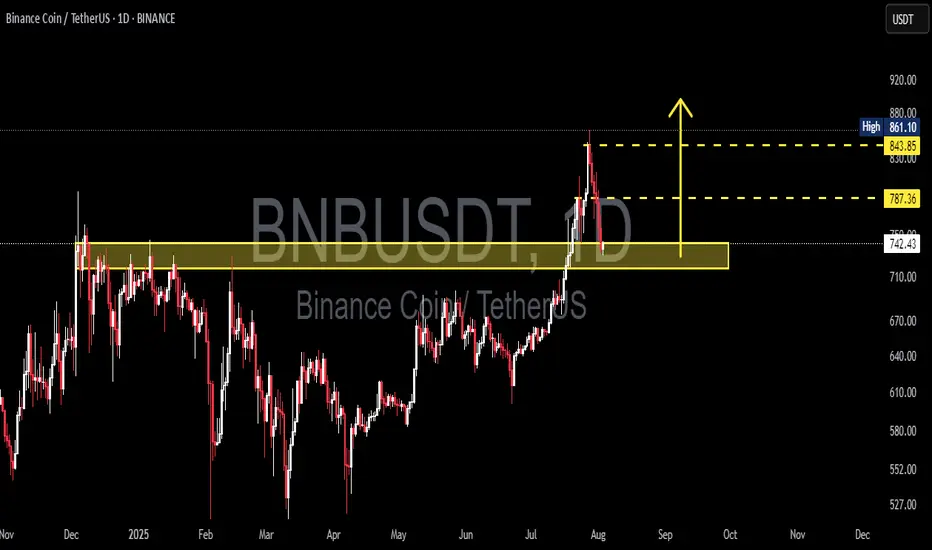
BNBUSDT Critical Retest in Progress📊 Comprehensive Analysis:
BNB/USDT has finally managed to break out of a major consolidation range that lasted over 6 months, with the key resistance zone between $730 and $750 acting as a strong ceiling since late 2024.
The breakout in late July 2025 was supported by a noticeable increase in volume, signaling strong accumulation and a possible shift from a ranging market to a bullish trend.
Now, the price is revisiting this previous resistance — a crucial retest zone that will likely determine whether this move is sustainable or a potential bull trap.
---
🔍 Key Price Levels Identified:
🟡 Retest Support Zone (Previous Resistance):
$730 – $750 → A critical area that must hold to maintain the bullish market structure.
🟡 Minor Resistance:
$787.36 → Recently rejected, this is the next short-term barrier that bulls must break.
🟡 Major Resistance (Swing High):
$843.85 → Key historical level before reaching the recent local high.
🔵 Recent Local High (Potential Double Top or Breakout):
$861.10 → A break above this level could open the doors to fresh highs.
---
✅ Bullish Scenario:
If BNB holds above the $742.36 level and prints a strong bullish reversal candle (e.g., pin bar or bullish engulfing), the retest can be considered successful.
Next upside targets:
🎯 $787.36 → Immediate resistance
🎯 $843.85 → Key swing high
🎯 $861.10 → Local high
🎯 $900 psychological level → If momentum and volume persist
Look for decreasing volume during retracement and surging volume on breakout to confirm bullish continuation.
---
❌ Bearish Scenario:
If the price fails to hold above $742.36 and breaks down below $730, this may confirm a false breakout (bull trap).
Downside targets could include:
⚠️ $710 – $690 → Minor demand zone
⚠️ $660 – $640 → Historical support within the previous range
A bearish confirmation would come from a lower high formation followed by a strong bearish breakdown candle with increasing volume.
---
📈 Chart Pattern & Price Structure:
The breakout indicates a bullish continuation pattern.
Potential formation of a Bullish Flag or an Ascending Channel, if support holds and consolidation continues above $740.
No major signs of distribution yet — the structure remains healthy and bullish.
---
🧠 Strategic Summary:
> The market has shown strong bullish intent, but it is now at a critical retest phase. Holding this zone could ignite the next leg up. Failure to do so, however, may signal a reversal or deeper correction.
For swing traders, the $730–$750 zone is a golden pocket for potential entries with tight risk management. For conservative traders, a confirmed breakout above $787–$843 offers a safer opportunity.
#BNBUSDT #BNBAnalysis #CryptoBreakout #Altcoins #TechnicalAnalysis #PriceAction #SupportResistance #BullishScenario #BearishScenario #CryptoTrading #BinanceCoin #SwingTrading
Binance Coin (BNB): Buyers Secured The 200EMABNB recently had a decent downside movement, where after reaching the 200 EMA line, buyers quickly reached and took control over that zone.
What we see here is proper upside pressure and bullish dominance, which can lead us back to the $850 area.
Swallow Academy

BNB Structural Analysis – Decision Zone & Bullish Setup Ahead!💎🚀 BNB Structural Analysis – Decision Zone & Bullish Setup Ahead! 🔥♦️
🔍 Dow Theory + Index Review + Market Structure Breakdown
✅ Like 💥 Follow 💬 Comment to keep this content coming daily!
👋 Hey traders! Welcome to our daily crypto routine:
📅 Every Day:
🔹 BTC + ETH technical updates
🔹 Full market structure review (TOTAL, BTC.D, USDT.D…)
📅 Every Sunday:
🔸 Weekly analysis of the Top 10 Altcoins (excluding BTC & ETH)
💎 Analysis method:
🧠 Dow Theory
📈 HWC Cycle – 1D timeframe
📉 MWC Cycle – 4H
🕐 LWC Cycle – 1H
📊 Index tracking: TOTAL / TOTAL2 / TOTAL3 / BTC.D / USDT.D
🔥 🧠 STRUCTURAL INSIGHTS – BNB, Market Context, and Trigger Points
♦️ Indexes Status
🔸 BTC.D – ⚠️ If 60.44 breaks down → bullish for altcoins. So far, the 62–62.36 zone has held as resistance – 🟢 still favorable for alts.
🔸 USDT.D – Currently trying to break 4.40, but hasn’t succeeded yet. This keeps the bullish bias intact.
💡 Before 4.13 breaks upward, we should already have open long positions.
🔸 TOTAL3 – Testing previous bottom – forming a potential double bottom.
💎 Breakout above 1.08T = 🟢 confirmation of a new altcoin wave, which could also support BNB’s rally
.
♦️ BTC Context – The Key to Altcoin Momentum
🟡 Still ranging between 115K–120K
🚀 Breakout above 120K could unleash strong rallies across alts – especially BNB.
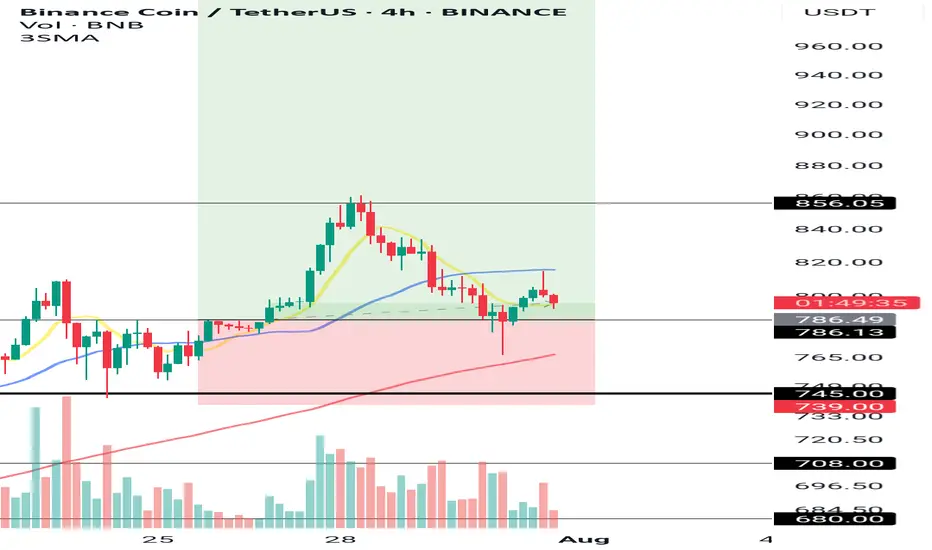
♦️ BNB/USDT Analysis – 4H Bullish, But Decision Time Is Near!
🔹 Trend:
✅ In the 4H timeframe, structure remains bullish – higher highs and higher lows still intact.
🔻 However, the latest price action has seen a deep correction from the 856 high, pushing price back into the daily support zone (745–786) = 📍 Decision Zone.
🛑 739 = key level. If it breaks, the 4H Dow structure breaks too.
💎 Key Levels to Watch:
• 🔼 Daily Resistance: 856.05
• 🔽 Key Daily Support: 745
• 🔽 Important 4H Support: 786.13
💎 Current Position Outlook:
✅ Entry at 786 = still valid and technically sound
✅ Stop-loss below 739 = protects the Dow structure
🎯 Targets: First 900, then 1000 – with potential for more if 1000 breaks
⚠️ Alternate Entry Trigger (Safe Setup):
🚀 If you missed the 786 entry:
📍 Wait for a break of previous 4H candle high (~805) WITH volume confirmation
🎯 Targets: 856 → 900 → 1000
🔁 Summary:
🟡 As long as the market holds above 739 and BTC doesn’t break down, this is a high-probability bullish setup
🔥 Break above 805 = a strong momentum trigger
📌 We stay bullish while respecting structure and volume
🚀 Smash that ROCKET if this analysis helped!
💬 Drop your thoughts in the comments
👍 Like & 🔔 Follow for daily updates and altcoin strategies
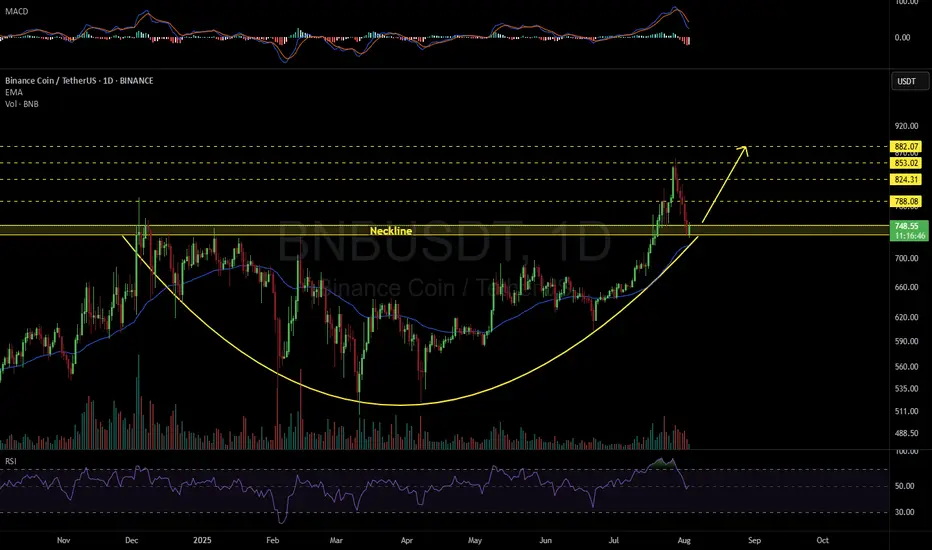
BNBUSDT 1D#BNB can continue its upward movement if — and only if — it holds above the neckline and confirms it as support.
If that happens, the potential targets are:
🎯 $788.08
🎯 $824.31
🎯 $853.02
🎯 $882.07
⚠️ As always, use a tight stop-loss and apply proper risk management.
Crypto: BNBUSDT to hit 800 this weekLike I told on ETHUSDT in my last trade which hit TP level exactly with no drawdown:
, this is same trade like ETH on BNBUSDT, with my back testing of this strategy, BNBUSDT need to touch 800 this week or next monday.
This is good trade.
Don't overload your risk like Greedy gambler!!!
Be Disciplined Trader, what what you can afford.
Use proper risk management
Disclaimer: only idea, not advice

Cycles Don’t Lie — But Which One Speaks Here ?Markets love to repeat themselves.
But just because something repeats, doesn’t mean it’s predictable — or useful.
Let’s break down the main types of market cycles that traders talk about, and more importantly, let’s call out their flaws. No sugarcoating.
🔹 1. Time Cycles
These are based on the idea that price behaves in a similar way over specific time intervals — whether it’s 90 days, 4 years, or a custom Fibonacci count.
They show up in seasonal patterns, halving cycles (like Bitcoin), or through tools like Gann, Hurst, or even basic cycle lines.
The problem?
– The exact timing is rarely clean. A 120-day cycle might play out in 87 days next time.
– Flat, choppy markets will destroy any cycle-based setup.
– Different timeframes show different "cycles," so good luck aligning them.
– Most cycle tools are complicated and impractical for real-time decision making.
🔹 2. Psychological Cycles
The famous emotional rollercoaster: Hope → Euphoria → Fear → Panic → Capitulation → Depression → Optimism.
Every bull and bear market goes through these in some form — in theory.
The problem?
– It’s almost entirely subjective. Everyone sees a different phase.
– You usually recognize the cycle only after it’s over.
– Emotions aren’t equal across all assets — BTC retail emotions ≠ S&P500 institutional sentiment.
– There’s no precise tool to measure this. You’re mixing vibes with candles.
🔹 3. Structural Cycles (e.g. Wyckoff)
This one’s more about price behavior itself — accumulation, markup, distribution, markdown. The idea is that markets rotate through these four structural phases again and again.
The problem?
– Identifying where you are in the structure is hard in real time.
– Markets don’t always follow the Wyckoff textbook. Sometimes they just... go.
– It relies heavily on volume — and that doesn’t always align.
– Traders love to force a structure where there isn’t one. Confirmation bias, anyone?
🔹 4. Macro Cycles
Classic economic boom and bust: Expansion → Peak → Recession → Trough.
These cycles move slow but shape everything — interest rates, employment, growth, and eventually, risk assets.
The problem?
– They’re way too slow to help short-term traders.
– Good luck timing the top or bottom of the economy.
– Governments and central banks constantly interfere with natural cycles.
– Most macro data is lagging, so you’re reacting to history, not forecasting the future.
🔹 5. Liquidity / Volume Cycles
This idea tracks capital flow: when liquidity comes in, prices rise. When it dries up, risk assets fall. Simple, right?
The problem?
– Volume isn’t universal. Crypto volume =/= stock volume =/= forex volume.
– You can’t always track capital flow accurately, especially in OTC markets.
– Low volume doesn’t always mean weakness — sometimes it’s just summer.
– Volume data can be misleading, especially on shady exchanges.
🔹 6. Fractal Cycles
Markets repeat — at every level. 5-minute looks like the 4-hour, which looks like the daily. Elliott wave, harmonic patterns, whatever — the idea is that patterns echo across timeframes.
The problem?
– Pattern recognition can be wildly subjective.
– The market doesn’t always care about geometry. Sometimes it’s just noise.
– By the time a pattern is “confirmed,” you missed the move.
– Focusing too much on pattern symmetry makes you blind to macro/fundamentals.
So after breaking all that down, let’s finally get to the chart in front of us.
Let’s take a closer look and see which cycle has actually played out here — and more importantly, which one actually helped :
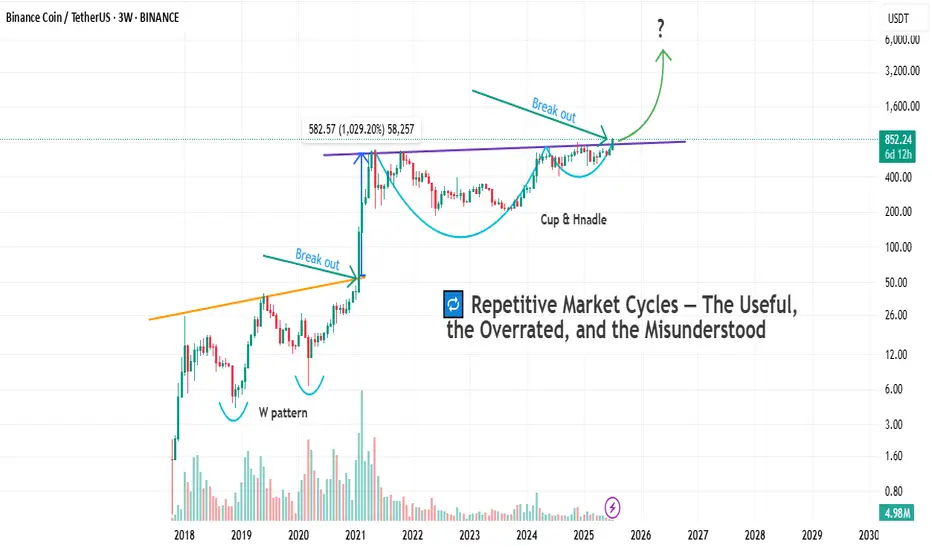
As you can see on the chart, before every breakout above the previous all-time high, the market tends to form some sort of bottoming structure or reversal pattern.
And once that structure completes, the actual breakout usually leads to a solid price pump.
But here’s the key question:
Which one of the cycles we talked about earlier does this actually follow?
If you ask me, a professional trader will always try to use every tool available — not because any single one gives you the answer, but because combining them gets you closer to what's likely to happen.
And that’s what separates a well-rounded trader from a one-dimensional one.
Why do I say “one-dimensional”?
Because if you insist on looking at the market through a single lens, you’re bound to make bad decisions. We’re not here to prove our personal theories — we’re here to profit from what actually happens in the market, not what we think should happen.
In the chart above, we actually see a mix of all the cycles we talked about.
But I’d love to hear from you as well — let’s brainstorm together.
What do you see here as a trader?
And what’s your take on this setup?
Bottom Line
Yes, markets repeat.
But repetition doesn’t equal reliability.
Every cycle has its use — and its blind spot.
Know the difference. Use what fits your style.
And don’t romanticize a model just because it looks clean on a chart from six months ago.
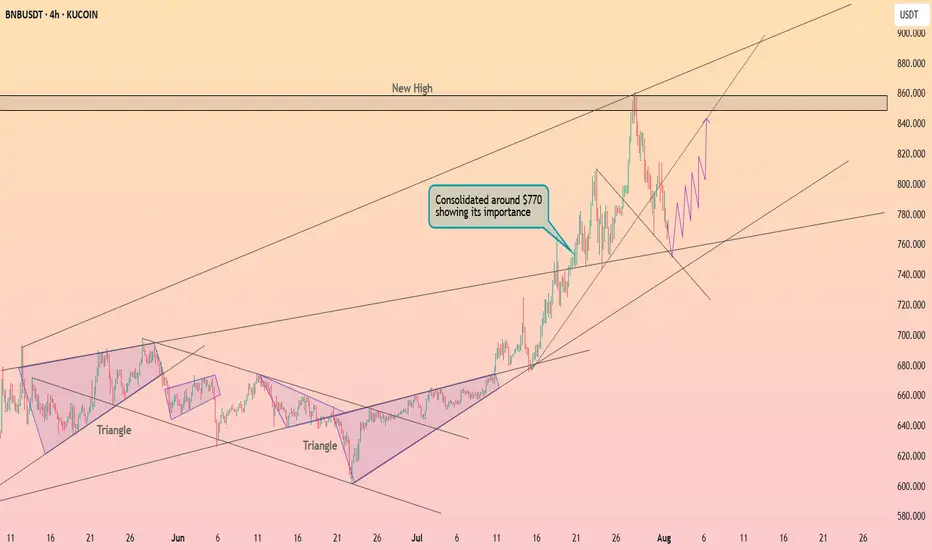
Binance coin around $760 ┆ HolderStatBINANCE:BNBUSDT has retraced from its recent high and is consolidating just above $770, a former resistance now acting as support. A bounce from this level would reinforce the uptrend and open the door for a potential push toward $860, continuing the bullish structure.
BNB/USDT 4H Chart: Rising Channel with Fractal Vibes!Hey traders! Binance Coin is showing some promising action that’s got me on the edge of my seat!
We’ve got a clear rising channel in play, with BNBUSDT moving beautifully in sync with a fractal line pattern shown above the chart — mirroring past price behavior like a roadmap! BNBUSDT is currently trading at $650 , I think price will continue bouncing between the channel’s support at $620-$600 and move upwards to the key resistance target at $700-$720 . A breakout above this resistance could send BNB soaring to new highs, potentially targeting $800 or beyond!
However, if BNB fails to break through, we might see a pullback to the channel support at $620-$600 .
Key Levels to Watch:
Resistance: $700-$720
Support: $620-$600
Breakout Target: $800+
Breakdown Risk: $600
Is BNB about to blast through $720, or will it retreat below support? Let’s hear your thoughts below!

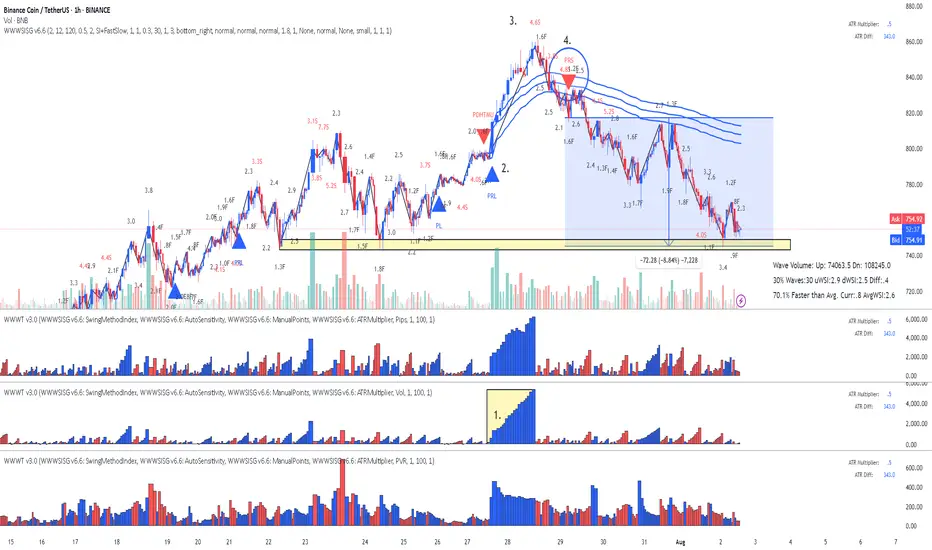
BNB Binance Coin: Lesson 15 methodology did the job again
Lesson 15 methodology (annotations in sync with the chart):
1. Largest up volume wave after a while - sellers might be in there.
2. Placed AVWAP and waited for price to cross downwards and pullback again on AVWAP
3. HTMU (hard to move up) - Abnormal Speed Index 4.6S at the top
4. Entry short signal PRS with abnormal SI 4.8.2 (price has a hard time to move up - absorption)
Simple as that. Enjoy!
BNB LONG TRADE SETUPNew Trade Setup: BNB-USDT
LONG
Entry: 803.50 OR CMP
Target: TP1: 816.54, TP2: 829.57, TP3: 842.61, TP4: 855.64
Stoploss: 773.84
Leverage: 1X
Technical Analysis: BNB/USDT is currently facing strong support. There is a high probability of a short-term upward move.

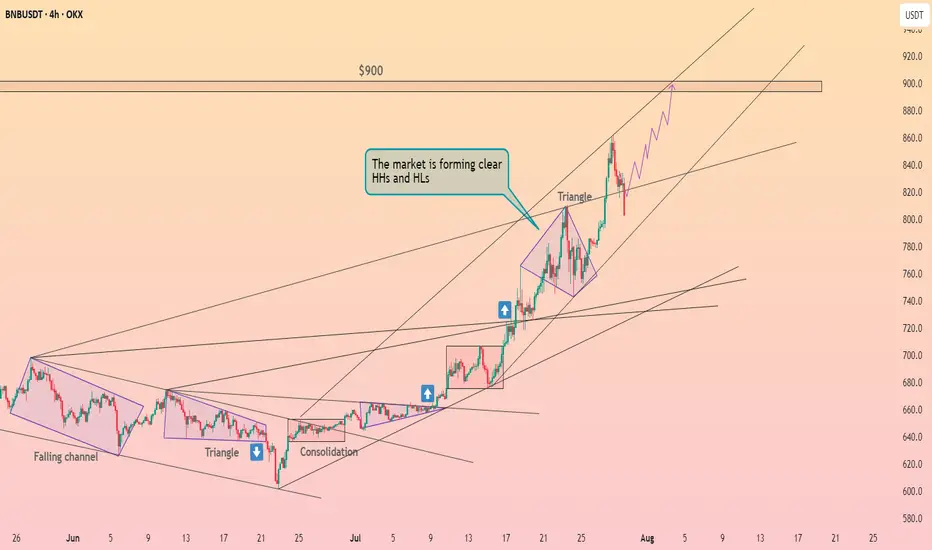
Binance coin has fallen below the resistance line ┆ HolderStatBINANCE:BNBUSDT continues to form clear higher highs and higher lows, trending inside a steep ascending channel. After breaking out of a bullish triangle, momentum remains strong as price eyes the 900 mark. Buyers are clearly in control unless key support levels break.
BNB - Challenging chart to analyzeBINANCE:BNBUSDT CRYPTOCAP:BNB CRYPTOCAP:BNB.D
Technical analysis :
BNB is one of the most challenging charts to analyze. I will try to decypher the hidden patterns.
The BNB was in accumulation range for more than 1 year. The blue parallele channel limits the price movement.
Today, BNB is trading in the historical distribution level presented by the green rectangle. This shows the solid accumulation.
Psychological analysis :
The BNB was holding very well during recent BTC decline, which make It very attractive for investors as the project and the platform are strong. BNB will always be holding good as the platform is still attracting more and more traders all around the world. If Binance is not OK , all crypto market will be impacted.
Risks :
- Gorvernment fighting the platform
- Hacking
Rewards :
The main target of BNB is $850. If this level is broken with big volume, the next target is $1,000.

BNBUSDT - New ATH!"The strongest resistance level on the chart has just been broken — which was represented by the previous ATH — after nearly four attempts.
This exact pattern occurred before in 2021, and what followed was a parabolic rally.
The same scenario is unfolding now!
You’ll soon see BNB trading in four digit
When the crowd doubts — the smart money loads up.
Expect a parabolic rally once sentiment flips.
Best Regards:
Ceciliones🎯
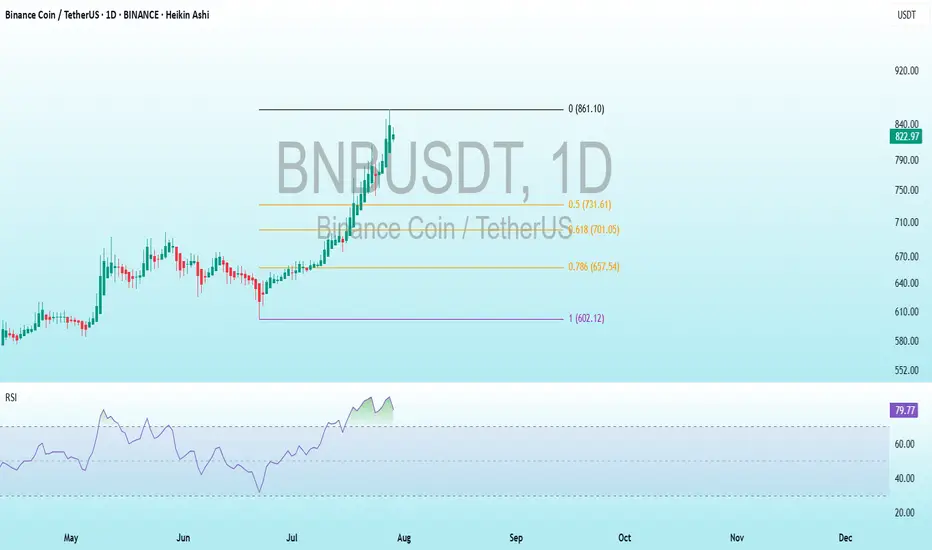
BNB Bearish DivergenceBINANCE:BNBUSDT
Trade Setup:
Target 1: 731.61 (0.50 Fibonnaci Golden Zone).
Target 2: 701.05 (0.618 Fibonnaci Golden Zone).
Target 3: 657.54 (0.786 Fibonnaci Golden Zone).
Target 4: 602.12 (1 Fibonnaci).
Stop Loss: 861.10 (above recent high, ~25% above current price).
RSI Analysis: The RSI shows a bullish divergence (price making lower lows while RSI makes higher lows), suggesting potential upward momentum. Current RSI is around 79.74, nearing overbought territory (>70), so caution is advised.
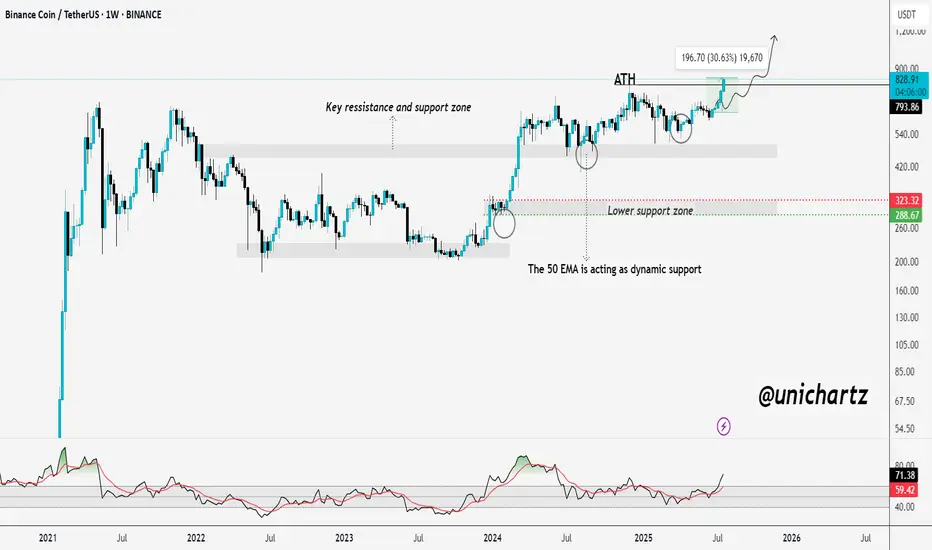
DeGRAM | BNBUSD broke the channel📊 Technical Analysis
● Daily candle closed back above the long-term median of the black rising channel after piercing the May-to-July grey resistance fan — a textbook “break-retest” that shifts the line into support at $793.
● Structure remains a staircase of higher-lows; the present pull-back is finding bids on the steep intraday trend-fan. A measured move of July’s pennant plus channel geometry converge at the round $900 barrier.
💡 Fundamental Analysis
● Binance’s 26ᵗʰ burn on 25 Jul destroyed 2.37 M BNB (~$1.9 B), shrinking circulating supply, while BNB Chain TVL rose another 4 % this week, underscoring persistent on-chain demand.
✨ Summary
Long $795-810; hold above $793 points to $835 → $900. Bull bias void on a daily close below $741.
-------------------
Share your opinion in the comments and support the idea with a like. Thanks for your support!

Bnb scalp short to $825 areaAnticipating a correction bnb soon. THe trend is still bullish but chancing a short as its quite high structurally. And saw signs of whales selling
Sl: $852.19 or higher
Tp: $825 area

BNB Breaks ATH – Just Like I PredictedBNB ATH Breakout – Just As Predicted 🚀
A few days ago, I said it loud and clear:
"Mark my words — BNB will not only retest its ATH but break it and go beyond before the year ends."
Well... today, it happened.
BNB just smashed through its previous ATH and printed a new all-time high, exactly as charted.
Strong structure ✅
EMA support held ✅
Momentum built up ✅
Bulls showed up ✅
This is what conviction backed by TA looks like.
Perfect Sync: V Reversal Meets Bull Flag
Two clean and classic technical structures:
✅ V-Reversal Formation
✅ Bull Flag – still active and building pressure
After a sharp reversal, the price entered a bullish continuation phase.
Currently moving within the flag structure toward its upper edge.
If we see a breakout to the upside, the move could match the flagpole length, which aligns well with the target from the V-reversal pattern.
📍 Bullish scenario remains valid as long as we stay within structure.
📉 Breakdown below $570 invalidates this setup.
🧠 Important Reminder:
Enter only after a confirmed breakout.
✅ Apply strict risk management
✅ Never risk more than 1% of your capital on a single position.
Everything’s clear. No noise. Just wait for confirmation — let the market come to you.
