bnbusdt"🌟 Welcome to Golden Candle! 🌟
We're a team of 📈 passionate traders 📉 who love sharing our 🔍 technical analysis insights 🔎 with the TradingView community. 🌎
Our goal is to provide 💡 valuable perspectives 💡 on market trends and patterns, but 🚫 please note that our analyses are not intended as buy or sell recommendations. 🚫
Instead, they reflect our own 💭 personal attitudes and thoughts. 💭
Follow along and 📚 learn 📚 from our analyses! 📊💡"
BNBUSDT trade ideas

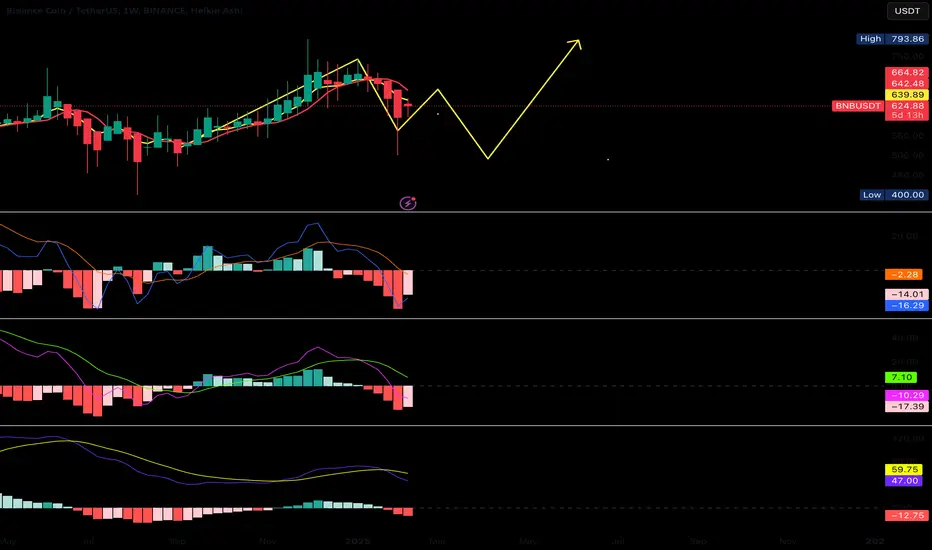
Can BNB reach around $1000 ?...Currently, BNB is forming an ascending triangle, indicating a potential price increase. It is anticipated that the price could rise, aligning with the projected price movement (AB=CD).
However, it is crucial to wait for the triangle to break before taking any action.
Give me some energy !!
✨We spend hours finding potential opportunities and writing useful ideas, we would be happy if you support us.
Best regards CobraVanguard.💚
_ _ _ _ __ _ _ _ _ _ _ _ _ _ _ _ _ _ _ _ _ _ _ _ _ _ _ _ _ _ _ _
✅Thank you, and for more ideas, hit ❤️Like❤️ and 🌟Follow🌟!
⚠️Things can change...
The markets are always changing and even with all these signals, the market changes tend to be strong and fast!!

BNB USDT🎯 CRYPTOCAP:BNB (Binance Coin) Analysis
📉 Descending Wedge Breakout → Retest → Uptrend Confirmation 📈
BNB has successfully broken out of the falling wedge pattern, confirming strong bullish momentum! 🔥
🎯 Price Targets:
Target 1: $757.45
Target 2: $835.49
Target 3: $915.23
🚀 #BNB is set for a massive move! Keep an eye on this breakout as we head toward new highs!

BNB IS GONNA EXPLODE !#BNB has a clear pattern of a rising spike ended to a triangle with 5 waves
i think that this can attract the liq in the market and make all coins rise in BNB SMART CHAIN !
in this pattern the BNB can leads the market and be the next leader of the market after solana and xrp !

BNB - will there be enough time for further growth in this cycleHello everyone, I invite you to review the current situation on BNB. When we enter the one-month interval, we can see how the price, after a long period of bearishness, turned into an upward trend in which it came out on top of the long-term downward trend line. Currently, we can see the movement along the upward trend line, which is also a support line for declines.
Here we can see how the price is currently based on support at $ 670, however, if this support is broken, we can then see the price quickly descending again to the area of a strong support zone from $ 540 to $ 460.
Looking the other way, we can see that when the trend reverses, we first have a resistance zone from $ 744 to $ 810, only when we come out on top of this zone can we see further movement towards $ 893, which may open the way towards another strong resistance in the area of $ 1134.
The RSI indicator shows that we are staying above the upper limit, which could potentially indicate an approaching larger rebound, but before that we may still see an attempt at growth so that the indicator reaches its previous highs.

How to trade with V patterns !!!In trading, a V pattern is a chart formation that resembles the letter "V" and is used in technical analysis to identify potential reversals in price trends. It is one of the most common and recognizable patterns, signaling a sharp decline followed by a quick recovery.
Here's a breakdown of the V pattern:
Characteristics of a V Pattern
Sharp Decline (Left Side of the V):
The price experiences a rapid and steep drop, often driven by strong selling pressure or negative market sentiment.
This decline is usually quick and may occur over a short period.
Reversal Point (Bottom of the V):
The price reaches a low point where selling pressure exhausts, and buyers step in.
This is the point where the trend reverses, often accompanied by high trading volume.
Sharp Recovery (Right Side of the V):
The price rebounds quickly, mirroring the steepness of the initial decline.
The recovery is driven by strong buying pressure, often fueled by positive news or a shift in market sentiment.
Types of V Patterns
V Bottom (Bullish Reversal):
Occurs at the end of a downtrend.
Signals a potential reversal from bearish to bullish.
Traders look for confirmation of the reversal, such as a breakout above a resistance level or increased volume.
Inverted V Top (Bearish Reversal):
Occurs at the end of an uptrend.
Signals a potential reversal from bullish to bearish.
Traders watch for a breakdown below a support level or decreasing volume as confirmation.
How to Trade the V Pattern
Identify the Pattern:
Look for a sharp decline followed by an equally sharp recovery.
Use trendlines or moving averages to confirm the reversal.
Wait for Confirmation:
Avoid entering a trade too early. Wait for the price to break above a resistance level (for a V bottom) or below a support level (for an inverted V top).
Set Entry and Exit Points:
For a V bottom, enter a long position after the price breaks above resistance.
For an inverted V top, enter a short position after the price breaks below support.
Use stop-loss orders to manage risk, placing them below the reversal point for a V bottom or above the reversal point for an inverted V top.
Targets:
Measure the height of the V pattern and project it upward (for a V bottom) or downward (for an inverted V top) to estimate potential price targets.
Key Considerations
Volume: Higher trading volume during the reversal confirms the strength of the pattern.
Market Context: V patterns are more reliable when they align with broader market trends or fundamental factors.
False Signals: Not all V patterns lead to sustained reversals. Always use additional indicators (e.g., RSI, MACD) to confirm the trend.
The V pattern is a powerful tool for traders, but it requires careful analysis and risk management to avoid false signals and capitalize on potential opportunities.

BNB’s Explosive Comeback – Next Stop, ATH?CRYPTOCAP:BNB is currently exhibiting strong bullish momentum, making its way toward a key resistance zone near its all-time high (ATH).
The price is recovering from a critical support level and has reclaimed the ascending trendline, signaling renewed buyer confidence.

What is V pattern? V pattern is a basic trading pattern which happens when market gets chaotic!
It has a sharp decline(left angle) and a sharp recovery (right angle)
Most of the times, V patterns won't change anything and their effect on market is mostly nothing!
The trends will continue after these patterns are crafted!
for example look at the BINANCE:BNBUSDT Chart and you can see that the price was pretty stable. after a sharp deny and a sharp recovery, the price shall return to the ranging stat which It was in!
⚠️ Disclaimer:
This is not financial advice. Always manage your risks and trade responsibly.
👉 Follow me for daily updates,
💬 Comment and like to share your thoughts,
📌 And check the link in my bio for even more resources!
Let’s navigate the markets together—join the journey today! 💹✨

BNB Price Analysis: Can Binance Coin Hit $750 Next?The last two quarters have been fruitful for native exchanges' coins.
After WhiteBIT's WBT updated its ATH several times, now Binance Coin (BNB) is surging, reclaiming $700 with an 11% intraday jump and trading at $708.10. With daily trading volume up 88%, bullish momentum is building, making BNB a key contender in this month’s altcoin market rally.
BNB Market Overview:
📈 +11.17% in 24 hours – Trading volume at $3.71B (+87.43%)
📈 +21.47% in a week – Bullish trend intensifies
📈 Market Cap: $99.55B – 5th largest crypto, 3.14% market dominance
Technical Indicators Favor Bulls:
- RSI Surges Toward Overbought Levels – Strong bullish momentum.
- EMA 50/200 Shows Positive Crossover – Confirming trend continuation.
Key Price Levels to Watch:
🔼 Immediate Resistance: $720 – A break here could send BNB toward $750.
🔽 Key Support: $635 – A breakdown could lead to $600.
With market sentiment bullish, BNB could test $750 this month if the trend holds. However, a trend reversal could see a pullback to $635 or $600.

BNB ANALYSThe analysis is on daily time frame and will give you a long term view
If these analyses help you to make better profits then share this analysis with your friends
And post your questions below this analysis

History is repeating itself for BNB...Hello Traders 🐺,
Over the past few days, I’ve noticed that BNB is outperforming the overall market . After BTC.D consolidation , BNB started pumping , so I decided to publish an idea about it.
When I opened the chart, I saw something magical unfolding—a true piece of art, honestly!
So, as you can see in the chart, history is trying to repeat itself again . Let me explain it to you:
After the formation of a double top , the price enters a consolidation phase , or even better to say, we see a correction . This phase usually coincides with the BTC season, where we observe the formation of a rising wedge.
Then, the final phase begins when BTC.D starts dumping and the altcoin season kicks off . Right now, we are very close to breaking out of the rising wedge! 🚀
( Remember, this is not financial advice, and always do your own research )

BNB Ready for a Breakout? Cup & Handle Pattern in Play!#BNB is in a strong uptrend and is currently forming a cup and handle pattern on the 30-minute timeframe. This is a classic bullish continuation pattern, signaling a potential breakout.
Key Observations:
🔹 Higher Highs (HH) & Higher Lows (HL) indicate a healthy uptrend.
🔹 Bearish divergence spotted—indicating a possible retracement.
🔹 If support breaks, we may see a trend reversal.
🔹 If the handle completes and #BNB breaks out, it could be an ideal buying opportunity.
Strategy:
🔹 Wait for breakout confirmation above the cup resistance.
🔹 Entry: On breakout with volume.
🔹 Stop Loss: Below recent HL.
🔹 Target: Measure the depth of the cup for a price target.
Final Thoughts:
This setup has high potential, but always use proper risk management.
What’s your take on #BNB? Will it break out or break down? Comment below!

The key is whether there is support near the previous ATH
Hello, traders.
If you "Follow", you can always get new information quickly.
Please click "Boost" as well.
Have a nice day today.
-------------------------------------
(BNBUSDT 1D chart)
The HA-Low indicator is generated at 588.27 and is rising above the previous ATH.
Accordingly, the key is whether there is support near the previous ATH point of 692.90 and whether it can rise above 719.53.
If it falls below 677.22,
1st: 656.63
2nd: 582.63-616.76 (Fibonacci ratio 0.618(620.33))
You need to check whether there is support near the 1st and 2nd above.
-
The fact that the HA-Low indicator was created means that it has broken out of the low range.
Therefore, if it falls below the 588.27 point, you need to be careful because there is a possibility that it will renew the low again.
If it falls from the HA-High indicator and meets the HA-Low indicator, you should consider that the previous wave has closed.
Also, if it rises from the HA-Low indicator and meets the HA-High indicator, it is the same.
The point to watch is whether it will move sideways in the HA-Low indicator ~ HA-High indicator range or break out and create a new wave.
In that sense, the key is whether it can rise and receive support near 719.53.
-
Thank you for reading to the end.
I hope you have a successful trade.
--------------------------------------------------
- Big picture
I used TradingView's INDEX chart to check the entire range of BTC.
(BTCUSD 12M chart)
Looking at the big picture, it seems to have been maintaining an upward trend following a pattern since 2015.
In other words, it is a pattern that maintains a 3-year upward trend and faces a 1-year downward trend.
Accordingly, the upward trend is expected to continue until 2025.
-
(LOG chart)
Looking at the LOG chart, you can see that the upward trend is decreasing.
Accordingly, the 46K-48K range is expected to be a very important support and resistance range from a long-term perspective.
Therefore, it is expected that prices below 44K-48K will not be seen in the future.
-
The Fibonacci ratio on the left is the Fibonacci ratio of the uptrend that started in 2015.
In other words, it is the Fibonacci ratio of the first wave of the uptrend.
The Fibonacci ratio on the right is the Fibonacci ratio of the uptrend that started in 2019.
Therefore, it is expected that this Fibonacci ratio will be used until 2026.
-
No matter what anyone says, the chart has already been created and is already moving.
It is up to you how to view and respond to this.
If the ATH is renewed, there are no support and resistance points, so the Fibonacci ratio can be appropriately utilized.
However, although the Fibonacci ratio is useful for chart analysis, it is ambiguous to use it as support and resistance.
The reason is that the user must directly select the important selection points required to generate Fibonacci.
Therefore, since it is expressed differently depending on how the user specifies the selection points, it can be useful for chart analysis, but it can be seen as ambiguous to use it for trading strategies.
1st: 44234.54
2nd: 61383.23
3rd: 89126.41
101875.70-106275.10 (when overshooting)
4th: 134018.28
151166.97-157451.83 (when overshooting)
5th: 178910.15
-----------------

Take The All Lows Now Go UpI think it will make many moves to compete with SOL in the new period. The time is ready for BNB, which is slightly below ATH.

#BNBUSDTIt is also clear from the chart that if it can cross the red resistance line from the red flash magazine, it will have good growth.
And the chances of kissing near the ceiling are high

Lingrid | BNBUSDT false Breakout of November Low. LongBINANCE:BNBUSDT market saw a price squeeze and subsequently dropped below the November low. However, the price also made a false breakout by taking liquidity below that level. Additionally, it broke and closed below the upward trendline that has been supporting the price since August. This breakout may indicate a sideways movement. I believe the price could establish a range zone, as we observed similar price action in this area last year, from September to November. I expect that the market will enter an accumulation phase around this zone, potentially followed by a bullish move. My mid-term goal is resistance zone around 700
Traders, if you liked this idea or if you have your own opinion about it, write in the comments. I will be glad 👩💻

BNB LONG m15Binance Coin (BNB) is a cryptocurrency that can be used to trade and pay fees on the Binance cryptocurrency exchange. The Binance Exchange is the largest cryptocurrency exchange in the world as of January 2018, facilitating more than 1.4 million transactions per second.

BNB Chain Upgrade in Progress – Will BNB Skyrocket?BNB Chain Upgrade in Progress – Will BNB Skyrocket?
CZ recently hinted at an upcoming BNB Chain upgrade, with details expected soon. This news has contributed to a solid recovery for BNB.
However, will this upgrade trigger a breakout similar to what we saw in 2021? In terms of technology, the update appears positive for BNB, but from a broader perspective, it seems unlikely to drive a massive rally.
From my analysis, the maximum adjustment range for BNB could be around $700, specifically $670, before it retraces toward the $440 level.
Once both the weekly (W) and monthly (M) charts form a complete bottom, BNB could see another bullish leg. In the short term, however, there are no strong bullish signals indicating an imminent surge.
Let's discuss and debate.
BNB Weekly 50MA50MA has shown its potential as support with an earlier touch being bullish and the current though seeming to act bullish aswell, new highs will be coming

bnb buy midterm"🌟 Welcome to Golden Candle! 🌟
We're a team of 📈 passionate traders 📉 who love sharing our 🔍 technical analysis insights 🔎 with the TradingView community. 🌎
Our goal is to provide 💡 valuable perspectives 💡 on market trends and patterns, but 🚫 please note that our analyses are not intended as buy or sell recommendations. 🚫
Instead, they reflect our own 💭 personal attitudes and thoughts. 💭
Follow along and 📚 learn 📚 from our analyses! 📊💡"

BNB is going to explode !#BNB has a clear pattern of bullish ! as you can see there is 2 M harmonic pattern which can make the market rise also we have a clear pattern of liquidity movement to BNB check this out
in this chart we can see BNB.D / USDT.D this means that how much liq is BNB attracting which is bullish

BNB ANALYSIS🔮 #BNB Analysis 💰💰
As we see that there is a breakdown of the trendline in daily chart. We could see more correction or again a bearish momentum from its trendline after that a we could expect a bullish movement
🔖 Current Price: $616
⁉️ What to do?
- We have marked some crucial levels in the chart. We can trade according to the chart and make some profits in #BNB. Keep your eyes on the chart, observe trading volume and stay accustom to market moves.🚀💸
#BNB #Cryptocurrency #Correction #DYOR

$BNB: Im shorting this weekend pumpUsing a confluence of Resistance above: The Golden Pocket, the horizontal s/r level, clear Downtrend vs CRYPTOCAP:BTC too.
Will update the reasoning properly soon, stay tuned
