$BNB/USDT is trading within an ascending triangle pattern, showi$BNB/USDT is trading within an ascending triangle pattern, showing strong bullish potential as it approaches the resistance zone near 720 - 750 USDT.
The price is holding well above the key support/demand zone around 590 - 620 USDT, which has consistently provided a solid base for the uptrend.
The Stochastic RSI is rebounding from oversold levels, indicating a potential shift in momentum toward the upside.
DYOR, NFA
BNBUSDT trade ideas

BNB's situationBINANCE:BNBUSDT
It reached its own resistance zone again, which is also very prestigious.
The probability of breaking this resistance area is very high.
Above this resistance area we will enter long bnb✅
⚠️ Disclaimer:
This is not financial advice. Always manage your risks and trade responsibly.
👉 Follow me for daily updates,
💬 Comment and like to share your thoughts,
📌 And check the link in my bio for even more resources!
Let’s navigate the markets together—join the journey today! 💹✨

Bullish divergence on BNB- Bullish divergence between the trend and the RSI.
- Very good long opportunity right now.
- Good ratio.
----------------------------------------------------------------------------------------------
Goal : 2 000 000$ from 2 000$
Wallet last update : 4100$
Wallet today : 4800$
----------------------------------------------------------------------------------------------

BNB - USDT UPDATE on 4th January 2025...Slowly slowly.... If you are in the trade already than congrats ! If not yet... Be careful & don't rush... Sometimes is a much better to look for something else instead of taking "halfway "trade already...
Don't rush... You still got all year to trade! ;)
PS: printer friendly "KISS" chart... & BTW...leverage *10 on Binance recommended... ;)

Upward trendIn the weekly time frame, an Cup and Handle pattern is visible on the chart. It will take some time for it to fully develop. It seems that a large uptrend is on the way.

BNB/USDT: Potential Reversal and Breakout OpportunitiesCRYPTOCAP:BNB BNB/USDT: Potential Reversal and Breakout Opportunities
Analysis:
The chart provided is a 4-hour timeframe of Binance Coin (BNB) against Tether (USDT) on Binance. The chart employs various technical indicators and concepts, including Smart Money Concepts (SMC), price action, and ICT Elliott Wave strategies.
Price Action and SMC Analysis:
Break of Structure (BOS): Multiple BOS points are marked, indicating significant shifts in market structure. These are crucial for identifying potential trend reversals.
Change of Character (CHoCH): Several CHoCH points are noted, suggesting shifts in market sentiment and potential entry points for trades.
Support and Resistance Levels: Key levels are marked at 731.24, 710.73, 622.92, 618.69, and 543.60, providing potential areas for price reaction.
Volume Profile:
The volume profile on the right side of the chart shows high trading activity around the 710.73 level, indicating a significant area of interest for traders.
Indicators:
RSI (Relative Strength Index): The RSI is hovering around the 53.55 level, suggesting a neutral market condition but with potential for upward momentum.
MACD (Moving Average Convergence Divergence): The histogram shows green bars, indicating bullish momentum, but the recent red bars suggest caution.
Elliott Wave Analysis:
The chart shows potential Elliott Wave patterns, with corrective and impulsive waves marked. The current structure suggests a possible completion of a corrective wave, indicating a potential new impulsive wave.
Buy Strategy:
Entry: 710.73 (current price level)
Take Profit 1 (TP1): 731.24 (next resistance level)
Take Profit 2 (TP2): 751.19 (further resistance level)
Stop Loss (SL): 693.00 (below recent support level)
Sell Strategy:
Entry: 731.24 (if price fails to break above)
Take Profit 1 (TP1): 710.73 (current support level)
Take Profit 2 (TP2): 693.00 (further support level)
Stop Loss (SL): 745.00 (above recent high)
Follow @Alexgoldhunter for more strategic ideas and minds
This detailed analysis incorporates various trading strategies, including Price Action, Smart Money Concepts (SMC), and ICT Elliott Wave strategies to provide comprehensive buy and sell strategies. The indicators displayed on the chart, such as Fibonacci retracement levels, volume profile, and RSI, support the analysis and identify key levels for entry, take profit, and stop loss.

BNB Trendlinetrendline say everything about price ... in my openion according to double top usdt.D and double bottom total we can see price growth
DYOR

BNB-USDT 4h chart reviewHello everyone, let's look at the 4H BNB to USDT chart, in this situation we can see how the price has moved sideways from the uptrend line, and what's more, we can see how the price is staying on the local downtrend line.
Let's start, however, by defining the goals for the near future that the price must face:
T1 = $714
T2 = $730
T3 = $743
T4 = $756
Now let's move on to the stop-loss in case the market continues to decline:
SL1 = $703
SL2 = $686
SL3 = $672
SL4 = $658
SL5 = $638

BNB PrimeHey there, folks! Let me drop some fire analysis for you:
Aside from the fact that this coin belongs to the largest platform in the world by liquidity—making it a prime candidate for explosive moves—the technicals are lining up beautifully.
The chart tells an epic story: since 2021, the price has been stuck in a sideways channel. That’s a colossal four-year accumulation phase! But here’s the kicker: the channel has been broken decisively, followed by a solid retest.
Now, all eyes are on the action. Let’s watch and see what unfolds in the coming days.
Trade smart, trade bold, and may the markets be in your favor! 🎯🔥
CRYPTOCAP:BNB BINANCE:BNBUSD CRYPTO:BNBUSD BTSE:BNBUSD BYBIT:BNBUSDT BINANCE:BNBUSDT BITSTAMP:BTCUSD COINBASE:BTCUSD INDEX:BTCUSD BINANCE:BTCUSDT COINBASE:BTCUSDT

BNB's up trend explainedBINANCE:BTCUSDT
✅ The BNB currency is moving in an ascending channel on the daily timeframe in the short term, which has a good bullish guard, and we expect it to move towards the following targets in the mid term:
760, 793, 900, 1000
✅ The BNB currency has a slow movement speed but holds up well in corrections, which makes it a low investment risk 👌
⚠️ Disclaimer:
This is not financial advice. Always manage your risks and trade responsibly.
👉 Follow me for daily updates,
💬 Comment and like to share your thoughts,
📌 And check the link in my bio for even more resources!
Let’s navigate the markets together—join the journey today! 💹✨

bnbusdt in this position we have pointitive range
be aware dont use position give little patient in next 6 hours can see new way to your position

BNB acts very strong above a yearly resistanceBINANCE:BNBUSDT is currently in an accumulation phase above $700, a key yearly resistance level that has consistently marked the end of bullish movements whenever it was previously reached. We've been stagnating above this level for about three months now. I believe this is a great opportunity for swing traders offering a good risk-to-reward ratio. Unless there’s a black swan event affecting BINANCE:BTCUSDT or BNB, I see no reason why BNB wouldn’t reach $1,000 in the next few months.

BNB Bearish SetupBNB momentum towards the next support area ($695.00).
Current movement is bearish and price is testing the current support level.
Price failed to make Higher High instead, making Lower High from the previous peak of $732.
The price is expected to continue towards the next support level.

Trading opportunity for BNBUSDTBased on technical factors there is a Sell position in :
📊 BNBUSDT
🔴 Sell Now
🪫Stop loss 708.00
🔋Target 685.00
📏 R/R 2
💸RISK : 1%
We hope it is profitable for you ❤️
Please support our activity with your likes👍 and comments📝

Comment down the pattern name # crypto currency Hello Trader's
Here's some trade plan for Intraday
Comment down 👇 your idea 💡 which side you trade
Or Which pattern is This

According to daily bnbWelcome to McCarty. After the stupid failure, you can log in and continue with it.

BNB Technical Analysis: Neutral Trend with Bullish Potential### 📊 Comprehensive Technical Analysis of the Current Market
---
#### 🔹 Overall Market Trend: ADX Indicator
The ADX (Average Directional Index) shows a value of 8.61, indicating a very weak and neutral trend. The +DI value (21.80) is slightly higher than -DI (19.44), but the difference is negligible, suggesting no significant strength in the trend.
🔍 **Analysis:**
This condition reflects limited market movement and a lack of strong directional bias. Traders should approach cautiously and may prefer to wait for a stronger trend to develop before entering trades.
---
#### 📉 Overbought and Oversold Conditions: RSI and Stochastic Indicators
- **RSI (Relative Strength Index):** A value of 53.19 indicates neutral conditions, with no overbought or oversold levels. It is close to the midpoint (50) of the range.
- **Stochastic Oscillator:** %K = 57.87 and %D = 55.25 confirm the neutral state. The decrease in %K from 64.5 to 57.87 reflects a weakening of recent upward momentum.
🔍 **Analysis:**
The market is neither in an overbought (Overbought) nor oversold (Oversold) zone. This suggests the current limited fluctuations may continue unless a new catalyst enters the market.
---
#### 📈 Moving Averages Analysis: EMA and SMA
Short-term moving averages (10, 20, and 50-day) are all above long-term moving averages (100 and 200-day). In summary:
- EMA10 = 706.86 > EMA200 = 698.11
- SMA10 = 706.59 > SMA200 = 695.14
🔍 **Analysis:**
The alignment of short-term and long-term moving averages indicates a strong bullish signal, suggesting the potential for price increases in the mid-term. Based on this data, traders may look for buying opportunities.
---
#### 🔍 Key Indicator Analysis: MACD, CCI, and Momentum
- **MACD:** The MACD value (1.063) is above its signal line (0.85), generating a buy signal.
- **CCI (Commodity Channel Index):** A value of 71.60 is in the neutral range but close to positive territory.
- **Momentum:** A reading of -0.36 shows a slight negative bias, reflecting short-term weakness in upward movement.
🔍 **Analysis:**
While the MACD provides a positive signal for buying, the short-term weakness in momentum may result in a slight pause or minor price drop. Traders should wait for further confirmation before entering long positions.
---
#### 🛑 Key Support and Resistance Levels
**Classic Pivot Levels:**
- **Supports:**
- S1: 644.79
- S2: 594.87
- **Resistances:**
- R1: 737.93
- R2: 781.15
**Fibonacci Levels:**
- **Closest Resistance:** 723.59
- **Closest Support:** 652.43
**Camarilla Levels:**
- **Strong Support:** 686.17
- **Strong Resistance:** 703.24
🔍 **Analysis:**
The resistance at 737.93 and support at 686.17 are key levels that could define the market's direction. Traders can use these levels as entry and exit points for trades.
---
### ✅ Summary and Recommendations:
The current market trend is neutral, but bullish signals from moving averages and the MACD indicator stand out. However, weak momentum and the low ADX value suggest that the trend strength is not yet fully established. The best strategy in these conditions:
- **Buying Opportunities:** If the price stabilizes above the resistance at 737.93, consider entering a buy position.
- **Risk Management:** Set a stop-loss below 686.17.
- **Wait and See:** If resistances are not broken, the market may enter a consolidation phase.
⚠️ **Disclaimer:**
This analysis was generated entirely by AI and is intended for educational and informational purposes only. Please consult your own expertise or a professional advisor before making any decisions.

Binance showing interest from green zone to go down.Seller contribution signals shown from strong buyer zone.

BNB thesis investment Current Market Conditions
BNB is trading at $712.19 and shows strong bullish momentum, supported by key technical indicators like RSI and Stochastic above 50.
Key Levels and Strategy
Stop-loss: $700.00 (manages downside risk).
Take-profit: $730.00 (targets near resistance levels).
Exit Point: $720.00 (partial profit-taking to secure gains).
Resistance Levels: Watch $717.95 and $723.77 for potential breakout points.
Recommendation
The data supports an OPEN LONG position with a 75% confidence level, capitalizing on positive sentiment and increasing trading volume. Monitor resistance levels and adjust positions based on breakout or pullback scenarios.
Risk Management
With no current positions open, this presents a good opportunity to enter while implementing tight risk controls. Stay vigilant as the market remains dynamic.
Prediction:
BNB is poised for upward movement, with a high probability of reaching $730.00 in the short term if the market remains supportive. However, traders should watch for consolidation near resistance zones and adjust their strategies accordingly.

BNB SWING LONGSwing Long BNB Opened:
⠀
The 2021 all-time high is the most critical level for me to watch. Historically, this level has acted as a strong support and resistance zone. Additionally, the price recently tapped the first 4H order block, showing a solid reaction from a 4H perspective.
⠀
My trade strategy is grounded in sentiment (ATR) and general average price. Currently, all indicators have flipped green, even though the price hasn’t yet broken the previous internal swing high (1D perspective).
⠀
Key Levels:
2021 All-Time High, as strong support especially with the current 4H reaction from it
Current ATH, This level will be my 75% TP, since its bove 3R (which is my minimum required R per trade, also This level holds liquidity and offers potential for price discovery above, where i will take the 25% (1.2 dev)
Last Internal daily Swing High, Breaking this level could create upward momentum tp reach the minimum target of the ATH.
The daily ATR sentiment confirms a bullish bias with a green signal,. (Main criteria for system)
⠀
Trade Details:
Stop-Loss: Below the lowest wick from the 4H OB test. This area also aligns with the 4H 24/42 EMA, meeting my SL criteria.
Targets, 75% of the position will be exited at the current ATH. The remaining 25% will aim for the 20% deviation zone above the all time high, ($829.23 on Phemex linear charts).
⠀
This trade offers a potential R of 4.2, with a maximum of 5.1R in total on average.
⠀
Comparative Analysis:
Looking at the weekly BNB chart versus the daily BTC chart, I noticed similarities in structural behavior. While the timeframes differ, the fractal nature of the market validates this comparison.
⠀
Both charts show clear break-of-structure patterns with higher-low formations. On the BTC weekly chart, three BOS moves have occurred since the last low, mirroring 2 break of structures on the BNB chart. BNB is approaching its ATH without significant rejections, which I interpret as a sign of strength.

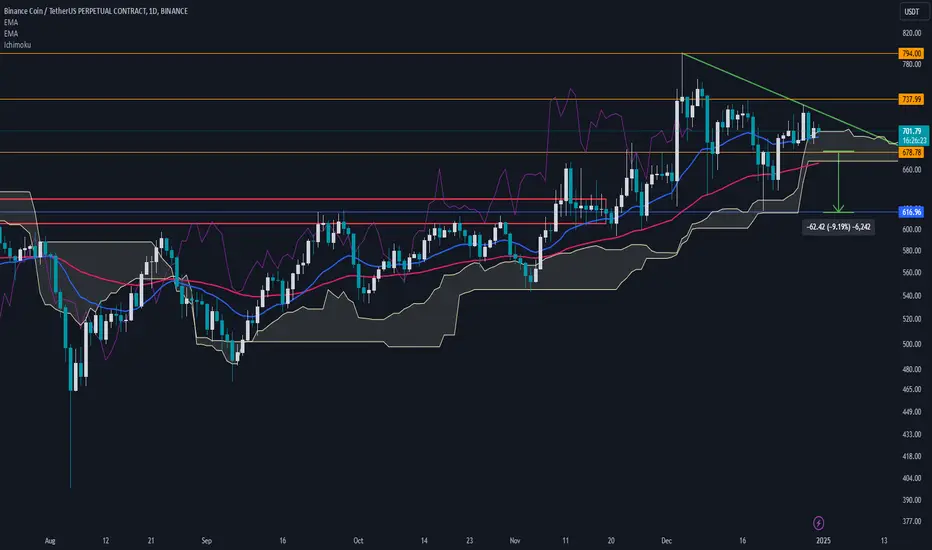
BNB Analysis: Key Levels to Watch for the Next Move 24.12.31Hello, this is Greedy All-Day.
Today's analysis focuses on BNB.
Review of the Previous Analysis
Let’s start by reviewing the previous analysis.
In the last analysis, I mentioned that if the red box resistance trendline is broken to the upside, there is a high probability of the price rising to the next supply zone.
The price initially faced resistance at the 720 level (first resistance), retraced slightly, but eventually broke through and rose to the upper boundary of the blue box supply zone at 731.
The resistance occurred at the green box high within the blue box.
Subsequently, the price failed to break the high, leading to a corrective phase.
BNB Chart from a Buy Perspective
From the daily chart, the resistance trendline has been drawn, extending from previous highs.
For new buy entries, it would be safer to wait for a breakout above the 738 level (red box).
Currently, with Bitcoin in a corrective phase and altcoins also struggling, entering at uncertain levels should be avoided.
If the price breaks above 738, a retest of the high—similar to what happened in the yellow box on the left—could occur, with a potential rise at least to the blue box supply zone.
BNB Chart from a Sell Perspective
Since the bullish candle on December 23, 2024, the price has consistently held above the 678.78 level.
If the red box is broken to the downside, the price could either create a long lower wick, as seen in the yellow box, or experience a complete fill, resulting in a significant decline.
Additional Evidence
The yellow box and the current high are similar, with a one-way drop previously resulting in a test of the 617 support level.
As of now, the 617 level, which acted as resistance from June 2024 to November 2024, has turned into support.
If the price drops, there’s a possibility of a 10% correction, with a one-way decline toward 617.
Conclusion
BNB is currently at a critical juncture. While there are opportunities for both upward and downward moves, waiting for confirmed breakouts or breakdowns will be key to minimizing risk and maximizing profit potential.
BNB 15M Reversal PlayLook how the market reversed and the day's sentiment shifted. 📉📈 You can see this in the charts, of course, but I now track sentiment with numbers.
The scores "UP and DOWN" before the ">" reflect the start of the day, while those after the ">" show the current sentiment. This shift means I’ll focus on searching for shorts instead of longs (for now)- which make this day a potential ''reversal play'' for me. All intraday.
But also, this is typical End OF Year chop, for example watch DOGE 15M trend, reversed 4 times which make this very bad to trade on for me with a 15M system.
BNB Numbers, factual structure:
- Structure: 1D: UP | 4H: UP | 1H: UP | 15M: DOWN > UP |
- First 2H (15M): UP
- 15M Sentiment: EMA's: UP > DOWN > UP | ATR: UP > DOWN > UP
- Up score 4/7 > 7/7"

Binance Coin (BNB): Possible Small Liquidity Grab / WaitingBinance coin has a possibility to break after filling the zone of liquidity on upper zones, where we had pretty strong reversals as well.
We are expecting now to see a break of that blue zone, which could trigger a further move to lower zones so we wait!
Swallow Team
