BNB/USDT longBNB second try:
SL: 586
TP: 680, 710, moon bag
Inverse H&S on higher time frame, retest of the neck.
When/if BNB closes above 616 --> long.
Move stop loss to entry price if close above 640.
BNBUSDT trade ideas


BNBUSDT Targeting 2021 All-Time High Amid CZ's Release!!BNBUSDT has successfully broken through key resistance levels and is gaining momentum towards the all-time high seen during the 2021 bull market. With Binance founder CZ set to be released today after serving 119 days in prison, this event may significantly impact BNB's price action.
Expecting a substantial upward movement, but as always, ensure you have your stop-loss in place to manage risk effectively.
BNBUSDT (1W Chart) Technical analysis
BNBUSDT Currently trading at $608
Buy level: Above $600
Stop loss: Below $500
TP1: $650
TP2: $720
TP3: $850
TP4: $1000
Max Leverage 3x
Follow Our Tradingview Account for More Technical Analysis Updates, | Like, Share and Comment Your thoughts

Is it worth investing in BNB in 2024?
Binance Coin (BNB) is the token of the largest cryptocurrency exchange Binance. BNB holders can get discounts of up to 25% on trading fees, participate in initial coin offerings, and earn passive income through staking. However, BNB remains volatile as its price depends on the success of Binance and the overall popularity of the crypto market.
In 2021, we witnessed an incredible rise — from $40 to $690 at its peak. But should we expect this success to repeat soon? I’ve conducted a thorough analysis, and here’s why I believe BNB is a good investment:
There are no serious competitors, and we won’t see any in the near future.
BNB is trading in an upward channel, as shown by coins like TWT.
Strong tokenomics: Binance burns part of the BNB supply quarterly, reducing the circulating amount.
New listings on Binance often provide additional opportunities for allocations.
There are many other positive factors. I recommend considering this opportunity.

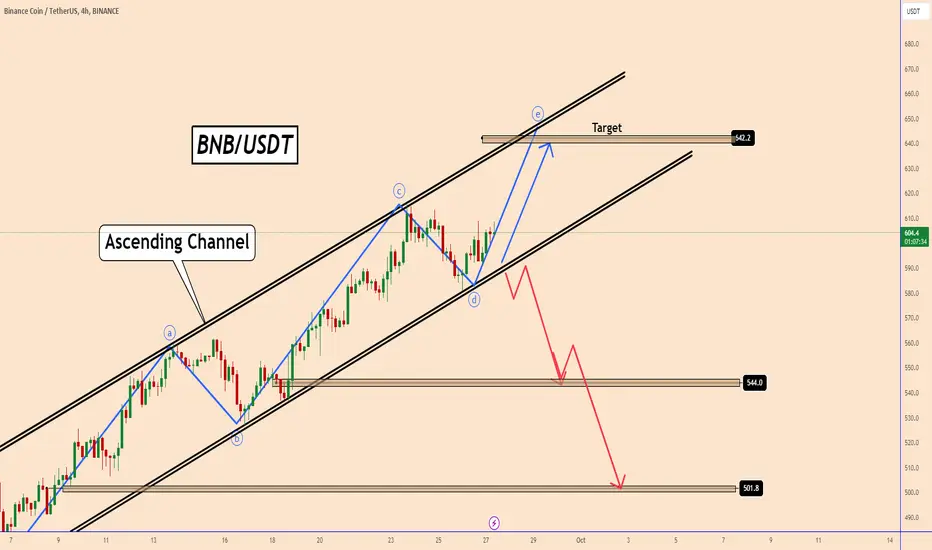
BNB Set to Rise for the “E” Wave of the PatternBNB Set to Rise for the “E” Wave of the Pattern
BNB is currently moving within a well-defined ascending channel, and the price is poised to rise for the next “E” wave of the pattern.
Given that BTC is also well-positioned for a bullish movement, it is likely that BNB will continue its bullish price development.
However, if the price breaks down from the channel today during the release of the US PCE data, it could open the door for a bearish scenario.
While the future is uncertain, it is wise to be prepared for both bullish and bearish moves.
You may find more details in the chart!
Thank you and Good Luck!
❤️PS: Please support with a like or comment if you find this analysis useful for your trading day❤️
BNB/USDT 4HOUR CHART UPDATE !!The chart shows a downward-sloping resistance line (white), which seems to have been tested several times. This line indicates a strong resistance area.
The green line probably represents an important moving average (potentially 200-period), which acts as dynamic support/resistance. In this case, the price has been interacting with this line frequently, sometimes as support and sometimes as resistance.
At the end of the chart, you can see a symmetrical triangle pattern forming between the sloping trendline and support levels. This usually indicates potential price consolidation before a breakout in either direction.
The green projected price path suggests a potential bullish breakout from the current triangle formation, heading toward the key resistance level of around $711.4. The zigzag pattern shows a potential retracement but overall upward momentum.
The price is currently around $602.1, slightly below the resistance area. A breakout above the triangle and the moving average could lead to a significant bullish rally.
Do you want further analysis on breakouts or key indicators?
Disclaimer: This analysis is for informational purposes and is not financial advice. Always stay updated with market movements and adjust your trading strategies as needed.

BNB trying to reset the indicatorHello, traders.
If you "Follow", you can always get new information quickly.
Please click "Boost" as well.
Have a nice day today.
-------------------------------------
The StochRSI indicator is showing signs of falling below 50 even though it has not fallen much.
In order for the StochRSI indicator to be reset, it must touch the oversold zone.
When the StochRSI indicator is reset and rises in the oversold zone and becomes StochRSI > StochRSI EMA, it is expected to create an upward wave if it receives support and resistance points on the 1M, 1W, and 1D charts drawn on the chart.
The point of view is how BTC will reset the StochRSI indicator.
-
Important support and resistance zones
- 578.4-595.0
- 496.0-498.3
The two zones above are important support and resistance zones.
-
If it falls below 595.0, the M-Signal indicator on the 1D chart is rising near 578.4, so you should check whether it can be supported and rise near this area.
Therefore, the key point is where the StochRSI indicator enters the oversold zone or the BW indicator touches the lowest point (0).
-
If it rises from 595.0,
1st: 606.7
2nd: 664.3
You should respond depending on whether there is support near the 1st and 2nd above.
-
Have a good time.
Thank you.
--------------------------------------------------
- Big picture
It is expected that the real uptrend will start after rising above 29K.
The section expected to be touched in the next bull market is 81K-95K.
#BTCUSD 12M
1st: 44234.54
2nd: 61383.23
3rd: 89126.41
101875.70-106275.10 (overshooting)
4th: 134018.28
151166.97-157451.83 (overshooting)
5th: 178910.15
These are points where resistance is likely to be encountered in the future. We need to see if we can break through these points.
We need to see the movement when we touch this section because I think we can create a new trend in the overshooting section.
#BTCUSD 1M
If the major uptrend continues until 2025, it is expected to start by creating a pull back pattern after rising to around 57014.33.
1st: 43833.05
2nd: 32992.55
-----------------

BNBUSDT SHORT 15M TF🚀The Atom Signals Trading View Indicator is a sophisticated tool designed for traders seeking to enhance their market analysis and trading strategies. Developed with the intention of providing clear and actionable signals, this indicator leverages a blend of technical analysis techniques to identify potential entry and exit points in the market. It aims to simplify the decision-making process by offering visual cues and alerts, which can be particularly valuable for both novice and experienced traders.🤖
🚀Key features of the Atom Signals Indicator include its adaptability to various trading styles—whether you're a day trader, swing trader, or long-term investor. By incorporating elements like trend detection, momentum analysis, and support/resistance levels, it provides a comprehensive overview of market conditions. This versatility makes it a useful addition to any trader's toolkit, regardless of the asset class they are focusing on, be it stocks, forex, cryptocurrencies, or commodities.🤖
🚀With its user-friendly interface on Trading View, the Atom Signals Indicator is accessible to traders of all experience levels. It not only aids in identifying trading opportunities but also assists in managing risk by highlighting potential reversals or consolidations. Whether you're looking to fine-tune your strategy or gain a fresh perspective on market movements, the Atom Signals Trading View Indicator offers a valuable resource for informed decision-making in the fast-paced world of trading.🤖
Based on the indicator we predict as shown in the charts.
You can check the indicator. You can DM for more info.
🚀Good Luck!

BNBSUD SHOWING A GOOD UP MOVE WITH 1:10 RISK REWARD BNBSUDSHOWING A GOOD UP MOVE WITH 1:10 RISK REWARD
DUE TO THESE REASON
A. its following a rectangle pattern that stocked the market
which preventing the market to move any one direction now it trying to break the strong resistant lable
B. after the break of this rectangle it will boost the market potential for break
C. also its resisting from a strong neckline the neckline also got weeker ald the price is ready to break in the outer region
all of these reason are indicating the same thing its ready for breakout BREAKOUT trading are follws good risk reward
please dont use more than one percentage of your capitalfollow risk reward and tradeing rules
that will help you to to become a bettertrader
thank you

BNBUSDT.1DAnalyzing the technical chart for BNB/USDT on TradingView, we see a clear representation of Binance Coin's price action against the US Dollar Tether on a daily timeframe. The chart indicates two primary resistance levels at $608.2 (R1) and $722.7 (R2), with corresponding support levels at $466.9 (S1) and $400.1 (S2).
The price of BNB is currently trending upwards as shown by the ascending support line, indicating sustained buying pressure. At this time, the price is around $588.3, placing it between the first support (S1) and the first resistance (R1) levels. This positioning suggests that BNB/USDT is in a critical consolidation phase with potential to either extend gains towards R1 or retract to test S1 again depending on upcoming market dynamics.
The Stochastic RSI indicator is nearing the overbought zone, which could signal a short-term pullback or consolidation if the indicator crosses downwards. Conversely, the MACD shows a bullish crossover with the signal line below the MACD line and a rising histogram, supporting the idea of continuing upward momentum.
Trading Strategy:
Bullish Outlook: If BNB/USDT maintains its support above the $466.9 level and breaks through $608.2 (R1), this could be considered a strong buy signal targeting the next resistance at $722.7 (R2). A stop-loss should be considered slightly below $466.9 to mitigate risk against a potential pullback.
Bearish Scenario: Should BNB/USDT fail to hold above the ascending support line and break below $466.9, this could indicate a reversal or deeper correction. In this case, a short position may be warranted with a target at $400.1 (S2), using a tight stop-loss just above $466.9 to manage risk.
Conclusion:
While the market sentiment for BNB/USDT appears bullish due to the positive MACD and the current price trend above the ascending support line, traders should remain cautious of potential volatility, especially with the Stochastic RSI nearing overbought conditions. Keeping an eye on key technical levels and maintaining a disciplined approach to risk management will be crucial in capitalizing on the inherent volatility of the cryptocurrency markets. As always, it's advisable to stay updated with any fundamental news that could impact market sentiment and cause abrupt price changes.

Binance Coin, Lower High ($300 Target Fully Explained)Binance Coin produced two major highs, marked here as March and May-April. After these highs, there was an attempt at a bullish breakout that failed. This produced a peak in June 2024. After this peak we have a major drop.
The June 2024 peak, we are going to ignore.
From this action, we are going to take the March and May-April highs as resistance. This would be our relative highs.
For Binance Coin to turn bullish based on technical analysis, it would need to move and close above these resistance levels, established earlier this year.
The major drop that started in June ended in August right at the 0.618 Fib. retracement level, relative to the bullish wave that started after the October 2023 price low.
This August low led to a pull-back and we are currently seeing a lower high being formed. The lower high remains valid as long as BNBUSDT trades below the March, May-April low shown with purple lines on the chart.
As long as BNBUSDT remains below these levels, we can expect another drop leading to a lower low. The lower low would send prices to next Fib. retracement level, 0.786. This is $314. When we consider the bearish momentum that can develop and the candle wick, Binance Coin can easily hit $300 if it fails to break resistance in the coming weeks.
Do you agree with this analysis?
Thank you for reading.
Namaste.

Binance Sets to List Hamster (HMSTR) With $14 Bln in LaunchpoolBinance is gearing up for yet another major token listing, with the highly anticipated Hamster Kombat ($HMSTR) set to debut on September 26. The platform’s Launchpool has already locked in over $14 billion, signaling immense market interest in this new Telegram-based play-to-earn (P2E) game. This massive figure marks a key milestone for Binance, showing both the game’s potential and the growing power of P2E gaming in the cryptocurrency space.
Hamster Kombat’s Airdrop and Binance’s $14 Billion Milestone
As part of the lead-up to the $HMSTR listing, Binance’s Launchpool initiative has locked over $14 billion worth of assets, primarily in Binance Coin ( CRYPTOCAP:BNB ) and FDUSD. These funds are being used to facilitate an airdrop of 3 billion HMSTR tokens, giving investors and gamers early access to the game’s in-game currency. The interest has been staggering, with 1.3 million BNB participants and over 2 billion FDUSD locked into the pool. This not only showcases strong demand for the $HMSTR airdrop but also speaks volumes about the P2E industry’s growth, with Telegram-based games proving to be a key engagement tool for crypto users.
As of September 25, the total locked value on Binance Launchpool reached $14,116,492,769, underscoring significant traction in the market. Investors have rushed to get a slice of the action, and excitement is building as the token airdrop nears its completion, with trading set to start just hours after the on-chain claim begins at 10:00 UTC on September 26.
Hamster Kombat: A Telegram-Based P2E Game Taking Off
Hamster Kombat is more than just a meme token. It’s a Telegram-based P2E game, providing players with an interactive experience where they can use unique cards and collect in-game diamonds to boost their profits. The game's first season recently concluded, and the second "interlude" season is already live, continuing the game's momentum ahead of its token listing.
Players in Hamster Kombat participate in a unique, competitive environment. With the introduction of a crypto exchange CEO simulator as part of the game’s core gameplay, users can engage in a fun, immersive experience that mirrors real-world cryptocurrency dynamics. The P2E nature of the game offers an additional layer of reward for users, further solidifying the game's appeal in the eyes of crypto enthusiasts.
Binance Launchpool and the P2E Trend
The Binance Launchpool has already been a launchpad for successful Telegram-affiliated tokens like $NOTCOIN, SEED_ALEXDRAYM_SHORTINTEREST1:DOGS , CATIZEN, and CRYPTOCAP:TON , positioning itself as a major player in bringing P2E games to the mainstream crypto audience. Hamster Kombat is simply the latest in this line of successful launches, but its monumental $14 billion lockup sets it apart from the rest.
With Binance’s involvement, the P2E trend is reaching new heights. The combination of easily accessible, Telegram-based gameplay and Binance’s robust platform gives the project strong market credibility. Given the increasing demand for interactive and rewarding crypto experiences, Binance’s decision to expand its support for P2E projects could very well spark a broader bull run in the gaming and meme token sectors.
CRYPTOCAP:BNB and Market Positioning
Amid all the excitement surrounding Hamster Kombat, Binance’s native token, BNB, has faced some downward pressure, trading down 1.13% at the time of writing. Despite this short-term dip, the broader narrative remains positive. Binance has successfully onboarded large numbers of users into the crypto space through these clicker-based Telegram games, showing the platform’s adaptability to emerging trends.
With CRYPTOCAP:BNB already integrated into the Binance ecosystem and heavily involved in the HMSTR airdrop, the token remains well-positioned to benefit from the broader momentum in P2E gaming and the upcoming bull run that many analysts predict for the cryptocurrency sector.
The Road Ahead: HMSTR’s Listing and Future Outlook
As we approach the September 26 listing of Hamster Kombat on Binance, it’s clear that the project has struck a chord with investors. With $14 billion locked in Launchpool, strong participation in both the CRYPTOCAP:FDUSD and CRYPTOCAP:BNB pools, and a vibrant in-game economy, Hamster Kombat is shaping up to be one of the most exciting new projects in the P2E space.
Market analysts are also watching closely to see how the $HMSTR listing will perform and whether it can follow the successful paths of previous Binance listings like $TON. With growing bullishness around both the game and its underlying token, the upcoming listing could be a pivotal moment for Hamster Kombat and the broader P2E gaming market.
As for Binance, its focus on innovative, user-friendly P2E games is helping the exchange solidify its role as a key player in the next wave of cryptocurrency adoption. With more tokens and games likely on the horizon, Binance seems well-prepared for the bull run that could be just around the corner.
Are you ready for the next big listing? Join the action as Hamster Kombat ($HMSTR) gears up for its launch and prepare for the excitement ahead!

BNBUSDT today Based on the BNBUSDT chart, we observe that BNB has encountered strong resistance in the 610 - 615 USDT zone (marked in orange), where the price reversed after failing to break through. Currently, BNB is trading around 596 USDT and finding support in the 590 - 595 USDT zone (marked in blue).
Technical Analysis:
BNB may experience a short-term recovery from the 590 - 595 USDT support zone, aiming to retest the resistance zone at 610 - 615 USDT. If BNB fails to break through this resistance, the price is likely to continue its downward correction.
A more bearish scenario could unfold if BNB breaks below the current support zone, potentially leading to a sharp drop towards the 580 USDT level, which serves as the next key support.
Conclusion:
In the short term, if BNB holds above the 590 - 595 USDT support zone, the price may recover and retest the 610 - 615 USDT resistance level.
However, if the price breaks below the current support, a significant drop towards the 580 USDT level may occur.

Inverse H&S SetupOn Monday, the Inverse Head & Shoulders pattern was activated. The initial target for this pattern is 684. The larger the short-term retracement, the better the risk-reward ratio.

Closing BNB position and taking profits.CRYPTOCAP:BNB #BNB #BNBUSDT #BNBUSD #Binance
Closing BNB position and taking profits.
I am not sure about market's stability. Too much green days. BTC seems like it can do one of those sharp selling day.

BNBUSDT. Trading opportunityHello traders and investors!
Daily Timeframe Analysis:
On the daily timeframe, the sideways movement that began in March continues. The upper boundary is 721.8, and the lower boundary is 495.8. The buyer's vector 10-11 is relevant, with a potential target of 645.2.
Two days ago, the buyer overcame 598 and reached 605.6, where volume accumulation started. If the buyer defends 598, the next targets are 635 and 645.
Hourly Timeframe Analysis:
On the hourly timeframe, there is an uptrend. The level marking the beginning of the last buyer's impulse is 587.9. I will be watching the buyer's reaction at the levels of 598 and 587.9.
Good luck with your trading and investments!

BNB/USDT longSL: 594
TP: 698
H Bull on RSI, Inverse H&S on higher time frame.
Move stop loss to entry price if close above 620.

BNBUSDTTwo possible play outs here. Expecting a breakout at the R1 & R2 Zone ($600.473 & $635). Or a possible rejection from the R2 zone down to $472 area.
Either way, one of these scenerios will play out before hitting $800.


BNBUSDT: Why BNB Remains Bullish and Its Next Potential MoveHi.
BINANCE:BNBUSDT
the BNB is in a ascending triangle now which means the price will increase and also It is expected that the price would at least grow as good as the measured price movement(AB=CD)
Note: we should wait for the breaking of the triangle and than make a move!
✨We spend hours finding potential opportunities and writing useful ideas, we would be happy if you support us.
Best regards CobraVanguard.💚
_ _ _ _ __ _ _ _ _ _ _ _ _ _ _ _ _ _ _ _ _ _ _ _ _ _ _ _ _ _ _ _
✅Thank you, and for more ideas, hit ❤️Like❤️ and 🌟Follow🌟!
⚠️Things can change...
The markets are always changing and even with all these signals, the market changes tend to be strong and fast!!

BNB USDTBNB is currently trading at around $603. The chart shows that BNB is approaching a crucial resistance zone on the monthly time frame, indicated by the blue shaded area. If the price momentum continues upward and successfully breaks this resistance, followed by a monthly close above it, we could see a bullish surge. This breakout could lead to significant gains in the upcoming bull rally. However, failure to break this resistance may result in continued consolidation. Stay connected with us for further updates on BNB's movement.

BNBUSDT Downtrend channel BreakoutBNBUSDT has broken and closed above the downward channel, signalling a bullish trend. This movement suggests the market may be factoring in the potential release of CZ, which could further fuel a rise in price. The break above the $600 psychological level supports this bullish sentiment. However, a pullback toward the channel's upper border and the upward trendline is possible. Monitoring price action during this pullback will be key to confirming further upside potential. The target is the resistance zone around 660.0

Lingrid | BNBUSDT Long Signal: Downward CHANNEL breakoutThe price perfectly fulfilled my last idea. It hit the target. BINANCE:BNBUSDT has broken and closed above the downward channel, which is a bullish sign. This move suggests that the market is likely pricing in the potential release of the CZ from jail, and this event could further propel prices to higher levels. Additionally, the price has broken and closed above the $600 psychological level, reinforcing the bullish sentiment. However, I anticipate a pullback toward the channel's upper border, as well as the upward trendline. Once this pullback occurs, I expect the market to continue its upward trend from that point. Keeping an eye on price action during the pullback will be important to confirm the potential for continuation. Mya target is resistance zone around 660.0
Traders, if you liked this idea or if you have your own opinion about it, write in the comments. I will be glad 👩💻
