BNB clear ideal invers head and shouldersmy analysis on BNB forming an inverse head and shoulders pattern . Here’s a more detailed breakdown:
1. Inverse Head and Shoulders Formation:
- The chart clearly depicts a classic inverse head and shoulders pattern, a strong bullish reversal signal. The pattern consists of two lower lows (the shoulders) and one deeper low (the head), indicating a shift from a bearish to a bullish trend.
- Entry Point: As you noted, the price is currently testing the 0.5 Fibonacci retracement level (~562.2). This is a common area for reversals in such patterns, making it a strong entry point for traders looking to ride the bullish momentum.
-TP1 : The first take-profit target sits at the 0.618 Fibonacci level (~622), which is often a critical resistance level. Traders tend to scale out of positions here to lock in profits, especially in case the resistance holds.
- **TP2**: The second target aligns with the 0.786 Fibonacci level (~665.8), which is a more ambitious upside goal, indicating further potential gains if the momentum continues.
3. Retest of Support:
- Before reaching TP1, the price may retest the neckline (currently around 0.5 Fibonacci) to confirm it as support that might be confirmed within few days. If the retest is successful, it would provide additional confidence for traders to hold positions for higher targets.
4. Projected Move:
- After a potential breakout past TP1, a move towards TP2 is probable if bullish momentum sustains. Finally, TP3 could represent the complete head-and-shoulders breakout target, which is the total height of the pattern added to the neckline, pushing prices beyond the current range.
Please make sure about key take away:
- Watch for **volume confirmation** during the breakout.
- Be cautious of **false breakouts**, especially around key levels (0.5 and 0.618), as price could retrace if the line is not touched at least 3 point as It was strong resistance for past few months.
This is a classic bullish setup, and following these levels with proper risk management could be profitable.
BNBUSDT trade ideas


BNB-USDT 8h chart review Hello everyone, let's look at the 8H BNB to USDT chart, in this situation we can see how the price has broken out of the downtrend line.
Let's start by setting goals for the near future, which include:
T1 =$627
T2 = $653
T3 = $669
T4 = $724.
Now let's move on to the stop-loss in case the market continues to decline:
SL1 = $587
SL2 = $568
SL3 = $539
SL4 = $516

BNB's Potential Surge: CZ's Release and Buyer Zone AnticipationThe recent developments surrounding CZ's release have sparked optimism across the market, potentially fueling a rise in BNB’s value. As seen in the chart, we are currently monitoring a key buyer zone (marked by the green box), which has been identified as a significant area of interest. If price action confirms this level, it could provide a strong entry point for buyers, aligning with the positive market sentiment following CZ's return.

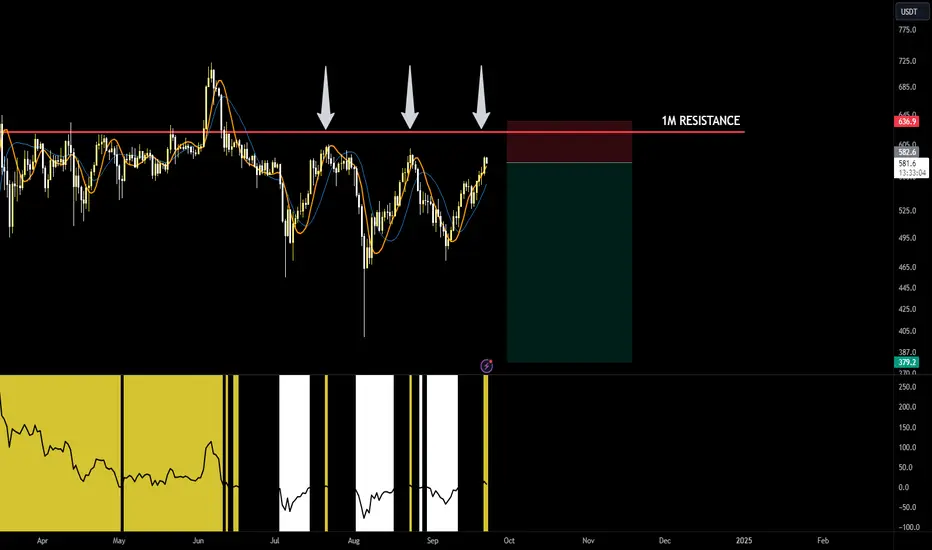
BNB suggests crypto is not ready for upside- update on this analysis:
- another yellow stripe flash
- with BNB having a rejection on the monthly time-frame it only makes sense to look for monthly downside targets
- therefore unlikely to find its bottom before the 350 level
BNBUSDT LONG 15M TF🚀The Atom Signals Trading View Indicator is a sophisticated tool designed for traders seeking to enhance their market analysis and trading strategies. Developed with the intention of providing clear and actionable signals, this indicator leverages a blend of technical analysis techniques to identify potential entry and exit points in the market. It aims to simplify the decision-making process by offering visual cues and alerts, which can be particularly valuable for both novice and experienced traders.🤖
🚀Key features of the Atom Signals Indicator include its adaptability to various trading styles—whether you're a day trader, swing trader, or long-term investor. By incorporating elements like trend detection, momentum analysis, and support/resistance levels, it provides a comprehensive overview of market conditions. This versatility makes it a useful addition to any trader's toolkit, regardless of the asset class they are focusing on, be it stocks, forex, cryptocurrencies, or commodities.🤖
🚀With its user-friendly interface on Trading View, the Atom Signals Indicator is accessible to traders of all experience levels. It not only aids in identifying trading opportunities but also assists in managing risk by highlighting potential reversals or consolidations. Whether you're looking to fine-tune your strategy or gain a fresh perspective on market movements, the Atom Signals Trading View Indicator offers a valuable resource for informed decision-making in the fast-paced world of trading.🤖
Based on the indicator we predict as shown in the charts.
You can check the indicator for free. Go to our links.
🚀Good Luck!

BNB TO THE MOONAs a supporter of CZ (Changpeng Zhao), I'm excited to analyze the chart showing the potential strong performance of BNB/USDT following CZ's release. Let's break down this promising outlook:
Technical Analysis
The chart clearly displays a classic "head and shoulders bottom" pattern, typically a strong reversal signal
Left shoulder: Formed around May
Head: The low point in mid-June
Right shoulder: Position from late August to early September
The completion of this pattern suggests that BNB may have ended its previous downtrend and is preparing for a new upward movement.
Price Targets
The marked price targets on the chart are exciting. From the current price of about $588, analysts predict BNB could rise to:
Short-term target: Approximately $709 (a $209 increase, 52.25%)
Medium-term target: An impressive $901 (a $313.4 increase, 52.25%)
Such gains would undoubtedly bring substantial returns for BNB holders.
The CZ Factor
While the chart itself doesn't directly mention CZ, as his supporters, we can speculate that his return to freedom might positively impact BNB's price:
Restored market confidence: CZ's return could boost confidence across the entire cryptocurrency community.
Leadership comeback: His vision and leadership skills might bring new development opportunities for Binance and BNB.
Innovation drive: CZ may push for new projects and improvements, further enhancing BNB's utility and value.

Binance triangle breakout! $BNB #BNB #BNBUSDT #Binance #BNBUSD
CRYPTOCAP:BNB #BNB #BNBUSDT #Binance #BNBUSD
Binance triangle breakout!

BNBUSDTmy entry on this trade idea is taken from a point of interest ABOVE an inducement.. I extended my stoploss area to cover for the whole swing as price can target the liquidity there before going as i anticipate.. just a trade idea, not financial advise

BNBUSDT - SHORT [Daily Signal]With each signal of movement for the dominant BTC, it is logical to expect movement in the same direction of the rest of the coins (with rare exceptions).
Circles mean what they mean, you know.
Stay tuned.

BNB Long EntryNew higher low at 527.
If price closes above 562 long potential till supply zone at 700

BNB/USDT 1H ChartHello everyone, let's look at the 1H BNB to USDT chart, in this situation we can see how the price is moving below the uptrend line and was struggling to maintain the level.
Let's start by setting goals for the near future, which include:
T1-$554
T2-$562
T3-$583
Now let's move on to the stop-loss in case the market continues to decline:
SL1 = $544
SL2 = $537
SL3 = $527
SL4 = $509
Looking at the RSI indicator, we see that we are above the upper line of the range, which may contribute to an attempt at a price recovery.

Binance Coin Lower High & Descending TrendlineThe latest lower high, 15-September, did not reach the "descending trendline." This is a sign of weakness and reinforces the chart's bearish bias.
Every time Binance Coin produced a pull-back the major descending trendline worked as resistance. Seeing this level being challenged again on the most recent pull-back would be the norm. The fact that we are seeing very low volume and a reversal happening much lower than the trendline is a sign for concern, why?
Because even if prices start moving up again the main descending trendline in black remain valid as resistance and would likely produce a breakdown and potentially a lower low.
➖ BNBUSDT continues bearish. A move and close above $635 would give credence to the bullish case. Trading below this level is bearish.
Namaste.

BNB Short term : Short Price broke out of the trend line and formed a lower high yesterday.
Short position towards golden zone between 0.618 and 0.5 fibs


A triangle to watch for BNB Binance $BNB Although it is quite early, there is a nice triangle forming in Binance

BNB Long Update Two very important fib points that can act as support or resistance : 0.618, 0.38
Price retraced to the RBR demand zone on 4 Hr chart which coincides with 0.38 fib drawn from current high.
Long position here should have potential . Good risk return ratio as uptrend continues

BNB Long Price is approaching demand zone after recent high. Using fib we can see new golden zone coincides with the RBR demand zone. A long from here would suffice

$BNB $BNBUSDT Huge Range BoundIf you check price action on weekly and monthly, you will see that the price is stuck in a huge range bound starting from May 2021. First swept the low and after sweeping the old high ( $693 ) a strong bearish momentum has pushed the price tot the downside. As now we are seeing a corrective pullback to the upside, I assume the price will test $650 and above before targeting lows again.

BNB LONG 3HWhat is Binance Coin? BNB powers the Binance ecosystem and is the native asset of the Binance Chain**. BNB is a cryptocurrency created in June 2017, launched during an ICO in July, and initially issued as an ERC-20 token. Designed to be used for a fee reduction on the Binance exchange, its scope was extended over the years. BNB powers the Binance Chain as its native chain token. For instance, it is used to pay fees on the Binance DEX, issue new tokens, send/cancel orders, and transfer assets. BNB is also powering the Binance Smart Chain, which is an EVM-compatible network, forked from “go-ethereum”. It supports smart contracts and relies on a new consensus mechanism: Proof-of-Staked Authority (PoSA) consensus (“Parlia”), which incorporates elements from both Proof of Stake and Proof of Authority. BNB is used for delegated staking on the authority validator, leading to staking rewards for users and validators. Besides its on-chain functions, BNB has multiple additional use-cases such as fee discounts on multiple exchanges (e.g., Binance.com), payment asset on third-party services, and participation rights & transacting currency on Binance Launchpad.

BNB Ready to Rally to the Next Target Price ?1. Ascending Channel :
BNB seems to be trading within an upward-sloping channel marked by two yellow dashed lines, indicating a long-term bullish trend.
The price has bounced off the lower boundary of this channel several times in the past, confirming its significance as support.
2. Resistance Break :
The horizontal line around the $400-$500 zone acted as a major resistance, but recent price action shows that BNB has broken through this level, confirming a bullish breakout.
3. Price Targets :
Based on the chart’s projection and the continuation within the upward channel, the next price movement seems to suggest BNB could reach higher levels over the coming months.
The projected price movement, represented by the white line, shows a zigzagging upward trend toward the upper boundary of the channel, which could take the price towards $1,500 or more in the longer term (possibly within 2025).
BNB is currently in a bullish breakout phase and could continue its uptrend toward the upper boundary of the channel, with a medium-term target around $900-$1,500 depending on market conditions.
However, do keep in mind that cryptocurrency markets can be volatile, and external factors (such as market sentiment, regulatory news, and macroeconomic conditions) can influence price movements.
#DisclaimerON

BNB Long After price retraced to golden zone and bounced off 0.618 fib was looking for another entry to ride the up trend. A demand zone was formed between 527 and 536. Price retraced to this zone and bounced off again ( valid entry ) . Demand zone will act as new support (SL below).
Ride the long till around 650-680 region.

Retracement : Entries for Long PositionAs the price retraces I've higlighted potential reversal zones for long positions using Fibonnaci retracement. The strength of the uptrend will be dependent on where the reversal occurs.
