$BNB $BNBUSDT Huge Range BoundIf you check price action on weekly and monthly, you will see that the price is stuck in a huge range bound starting from May 2021. First swept the low and after sweeping the old high ( $693 ) a strong bearish momentum has pushed the price tot the downside. As now we are seeing a corrective pullback to the upside, I assume the price will test $650 and above before targeting lows again.
BNBUSDT trade ideas

BNB LONG 3HWhat is Binance Coin? BNB powers the Binance ecosystem and is the native asset of the Binance Chain**. BNB is a cryptocurrency created in June 2017, launched during an ICO in July, and initially issued as an ERC-20 token. Designed to be used for a fee reduction on the Binance exchange, its scope was extended over the years. BNB powers the Binance Chain as its native chain token. For instance, it is used to pay fees on the Binance DEX, issue new tokens, send/cancel orders, and transfer assets. BNB is also powering the Binance Smart Chain, which is an EVM-compatible network, forked from “go-ethereum”. It supports smart contracts and relies on a new consensus mechanism: Proof-of-Staked Authority (PoSA) consensus (“Parlia”), which incorporates elements from both Proof of Stake and Proof of Authority. BNB is used for delegated staking on the authority validator, leading to staking rewards for users and validators. Besides its on-chain functions, BNB has multiple additional use-cases such as fee discounts on multiple exchanges (e.g., Binance.com), payment asset on third-party services, and participation rights & transacting currency on Binance Launchpad.

BNB Ready to Rally to the Next Target Price ?1. Ascending Channel :
BNB seems to be trading within an upward-sloping channel marked by two yellow dashed lines, indicating a long-term bullish trend.
The price has bounced off the lower boundary of this channel several times in the past, confirming its significance as support.
2. Resistance Break :
The horizontal line around the $400-$500 zone acted as a major resistance, but recent price action shows that BNB has broken through this level, confirming a bullish breakout.
3. Price Targets :
Based on the chart’s projection and the continuation within the upward channel, the next price movement seems to suggest BNB could reach higher levels over the coming months.
The projected price movement, represented by the white line, shows a zigzagging upward trend toward the upper boundary of the channel, which could take the price towards $1,500 or more in the longer term (possibly within 2025).
BNB is currently in a bullish breakout phase and could continue its uptrend toward the upper boundary of the channel, with a medium-term target around $900-$1,500 depending on market conditions.
However, do keep in mind that cryptocurrency markets can be volatile, and external factors (such as market sentiment, regulatory news, and macroeconomic conditions) can influence price movements.
#DisclaimerON

BNB Long After price retraced to golden zone and bounced off 0.618 fib was looking for another entry to ride the up trend. A demand zone was formed between 527 and 536. Price retraced to this zone and bounced off again ( valid entry ) . Demand zone will act as new support (SL below).
Ride the long till around 650-680 region.

Retracement : Entries for Long PositionAs the price retraces I've higlighted potential reversal zones for long positions using Fibonnaci retracement. The strength of the uptrend will be dependent on where the reversal occurs.

BNB/USDT Long Update Analysis:BNB is showing bullish signs, attempting to move above the recent consolidation range. Currently trading around key support levels, and if the resistance is cleared, a breakout is likely.
Technical levels to watch:
$210-$220, a crucial area that has provided a solid base recently.
$200, which is a psychological level and an important line in the sand for bulls.
$240-$250, the upper boundary of the current consolidation and a crucial level to clear for bullish continuation.
$260-$270, aligned with previous high points and the 200-day moving average, if applicable.
BNB is forming an ascending triangle pattern, which is a sign of a bullish continuation. A break above the horizontal resistance line at $240-$250 could confirm this.
Positive divergence on the RSI or MACD could support a potential upward move.
An increase in buying volume, especially on a breakout above resistance, would strongly indicate a potential continued upside move.
Keep an eye on a move above 50, currently neutral but indicating strengthening bullish momentum.
Look for a bullish crossover near the zero line for additional confirmation of a trend reversal.
Consider long positions on a confirmed breakout above $240-$250 with strong volume. Pullbacks to the support zone near $220 could also provide a secondary entry opportunity with a tight stop.
$260-$270, aligned with the recent high and a crucial resistance level.
$300-$320, further upside if momentum continues and broader market conditions remain supportive.
Lose below $210 or the recent swing low to minimize downside risk in case of a bearish reversal.
Ensure proper risk management by adjusting position sizes according to stop-loss levels and overall risk tolerance.
Outlook:
BNB/USDT looks set for a potential bullish breakout provided it can hold support and gain momentum above key resistance levels. Closely monitoring confirmation signals such as volume spikes and positive technical indicator crossovers will be key in managing a successful long trade.
Disclaimer: This analysis is for informational purposes and not financial advice. Always stay updated with market movements and adjust your trading strategies as needed.

#bnbusdt time to pull back ! Needs to gain momentum for increase continuation ! Let's see what will happen after strong bear score via scorehood.

do you want to Buy Bnb ?! Buy ThereHi Dears.
in Bnb chart we can easily stand with Long ( bullish Movement ) positons
but if you want enter with low risk
there are 3 level that Bnb will reaction to them
I will enter for each level 5% wallet
stop lost will be set after last green Fvg filled
Cheers profit 🔥
@TradeWithMky

BNBUSDTmy entry on this trade idea is taken from a point of interest above an inducement.. I extended my stoploss area to cover for the whole swing as price can target the liquidity there before going as i anticipate.. just a trade idea, not financial advise

BNBUSDTmy entry on this trade idea is taken from a point of interest BELOW an inducement.. I extended my stoploss area to cover for the whole swing as price can target the liquidity there before going as i anticipate.. just a trade idea, not financial advise
BNB UppdateSo it looks like we have a good setup for some friday Bleeding in the crypto market.
looking to short Bnb inside the imbalance.

BNB Long Yesterday price formed a demand zone between 507 and 527. Today it broke and closed above that zone.
From trend view point the low of 472 is a higher low from the low of 400 .
200 day EMA looks to have become support at 509.
Potential long till 670

Binance Coin 6X SHORT (Full Trade-Numbers — 196% BD-Pot)Binance Coin's chart (BNBUSDT) looks very similar to Bitcoin, with the exception of the bull-trap in June.
The bull-trap is the most revealing signal of all. It confirms that the bullish wave ended. If a bullish wave ends, a bearish wave starts.
The bearish wave is already in process and after the bull-trap we have the requirements necessary to call the current price action a bearish trend; lower highs and lower lows.
After a three days bounce, weak volume, it seems the resumption of the bearish move comes next. This would imply a lower low compared to 5-August.
Market conditions can change.
This is not for beginners.
Experienced traders only.
___
SHORT BNBUSDT
Leverage: 6X
Targets:
3) $490
4) $465
5) $415
6) $385
7) $345
Stop-loss:
Adjust to your own risk tolerance
Potential profits: 196%
Capital allocation: 3%
____
This is not financial advice.
Do your own research and planning.
Thanks for your support.
You are appreciated.
Namaste.

Binance Coin Monthly Chart ($300 - $333 Next!)This chart leaves no room for doubt. Binance Coin (BNBUSDT) closed red three months straight and is now trading red for the fourth consecutive month.
➖ The action is happening below $523 which is the 0.382 Fib. retracement level for the entire bullish wave that started October 2023. This is an important level. While BNB trades below it, the bearish bias remains quite strong.
➖ A descending triangle is present on the chart but already broke bearish.
➖ Last month, BNBUSDT removed all support with a long lower wick that hit as low as $400.
👉 If there is another drop, as the chart is showing, prices can reach as low as $300 - $333.
While this is a negative development in the short-term, it would be followed by a strong, long-term recovery.
The chart is bearish and pointing down; stay away unless you are short.
Remember, things will get bad when the final down-leg starts to unravel and this will happen really soon. But do not get caught in the panic, this is a normal process that the market goes through at each cycle. It moves up and down, up and down; nothing new truly, it is as normal as it gets.
While the market will overreact, as usual, there is no need to panic because corrections tend to remove what isn't working and this is good for the long-term.
➖ Just make sure that you are protected, mentally and financially.
➖ Just make sure that you are aware.
➖ Just knowing what is coming can help you keep a calm mind while everything burns.
Namaste.

BNBUSDT.1DAnalyzing the BNB/USDT daily chart, we can observe a number of key technical aspects that guide my trading decisions:
Current Chart Formation:
The price action for Binance Coin (BNB) displays a descending trend line since its peak in June, indicating a prevailing bearish sentiment in the market. The recent attempts to break above this trend line have not sustained, suggesting strong overhead resistance.
Support and Resistance Levels:
The chart identifies a clear support level at $404.1 (S2) and $465.9 (S1), with resistance at $605.6 (R2). The intermediate resistance at $465.9 has been tested multiple times, which could become a pivot point for short-term price movements.
The key resistance at $605.6 aligns with previous highs and a psychological level that might see significant sell pressure if approached.
Technical Indicators:
The MACD is trending below the signal line but shows signs of converging, indicating potential weakening of the current bearish momentum. A bullish crossover here could suggest a shift in trend.
The RSI at 49.5 is nearly neutral, reflecting balanced buying and selling pressures. This neutrality in RSI points to indecision among traders, warranting a cautious approach.
Market Sentiment and Strategy:
Given the current market setup, my strategy involves closely monitoring the response at the $465.9 support. A convincing break below this could open the path toward $404.1, where I would assess market reactions for potential buying opportunities, anticipating a bounce back due to historical support.
Conversely, should the price push above $465.9 and sustain, I would look for entry points to capitalize on potential upward momentum, setting a target near the next major resistance at $605.6. However, this bullish scenario would need confirmation through increased trading volume and further bullish signals on both MACD and RSI.
Risk Management:
In either scenario, maintaining strict stop-loss orders slightly below or above key levels (depending on the position) would be prudent to mitigate potential losses from unexpected market turns.
By maintaining a disciplined approach and monitoring key indicators and levels, I aim to navigate the fluctuations in BNB's price effectively, capitalizing on clear trends and reversals while managing risks efficiently.

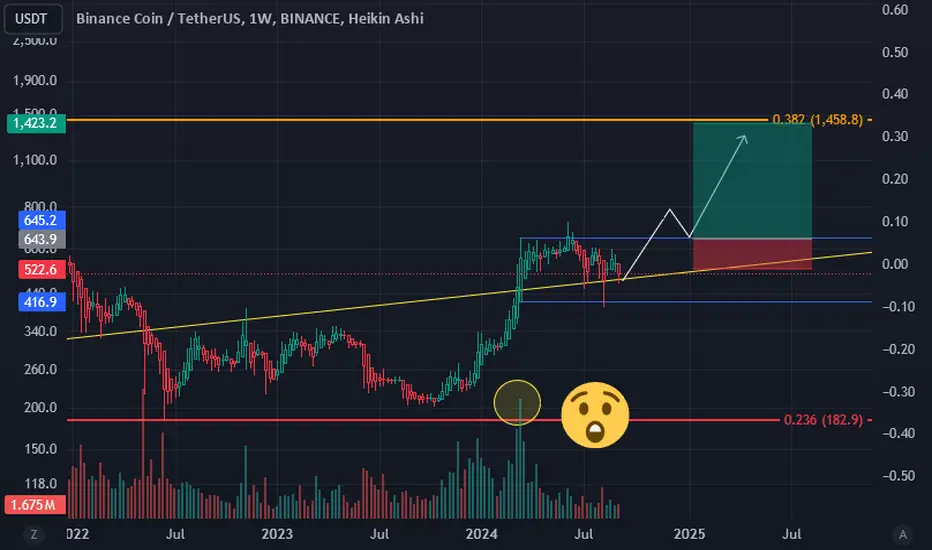
BNB/USDT Weekly Chart Analysis:!!The BNB/USDT weekly chart shows a long-term uptrend with a series of higher highs and higher lows since early 2021.
Recently, BNB has been in a consolidation phase, oscillating between strong support and resistance zones, but maintaining a long-term ascending trendline.
The key support level is around $450, which aligns with the long-term ascending trendline. This level has consistently acted as a solid floor for price action during pullbacks.
A major resistance level is around $676, marked by the previous high. A successful breakout above this level could open the door for further upside movement.
A continued bounce from the ascending trendline with a push towards the resistance at $676. A breakout above $676 could trigger a rally toward the $1,000 mark, with further upside potential in the longer term.
A failure to hold the support at $450 could lead to a deeper correction towards the next support level around $335 or lower.
The chart hints at a potential cup and handle formation, with the "cup" part of the pattern forming since the high in 2021. A breakout above $676 could confirm this bullish continuation pattern.
The smooth green curve suggests a possible projected path of the price, anticipating a gradual climb if key resistance levels are cleared.
Indicators and Volume:
Monitoring volume trends will be crucial; increased volume during a breakout above $676 would confirm the move's strength.
Oscillators such as RSI nearing overbought levels may indicate short-term pullbacks, but the overall trend remains bullish as long as the ascending trendline is respected.
The long-term outlook for BNB remains positive, especially if the price maintains above the ascending trendline. The projected path indicates potential growth towards $1,300 and beyond, contingent on maintaining the current upward momentum and breaking significant resistance levels.
A stop-loss just below the $450 support is advisable for long positions to mitigate downside risk.
For those looking at bearish setups, a confirmed break below the ascending trendline could warrant short positions targeting lower support zones.
The chart analysis suggests a strong bullish trend continuation for BNB, with significant upside potential if key resistance levels are breached. Watching how the price reacts around the $676 resistance will clarify the next major move further.
Disclaimer: This is not financial advice. Stay updated with market movements and adjust your trading strategy accordingly. Keep an eye out for further updates and analysis. Thank you!

BNB/USDT Breakdown: Head and Shoulders Pattern in Play!BNB/USDT is following through on the Head and Shoulders pattern and is already trending downward. Watch for potential further declines, and manage your positions with care as support levels may be tested!

8N8 USDT: 50.000 US token 8efore 2030?Hello.The 8N8/8TC ratio was at 2% one and a half years ago. it is now 8elow 1 % with an upward trend since the start of the 8inance token. If the trend is confirmed the price could exceed the price of 8TC 8efore 2030 , that is to say 54,000 US token today.
Fibonacci Retracement swing golden levels breakout-reversalThe "golden levels" — specifically the 1.618 , 2.618 and 3.618 retracement points — hold a special place. These ratios, derived from the Fibonacci sequence, are revered for their tendency to act as crucial support and resistance zones.Fibonacci sequence expresses the golden ratio 1.61803 and the market fullfills the structure most of the time by retracing the golden levels or zones.
The market has swings and fibonacci retracemnet tool helps to find the exact levels of breakout and reversals based on market trend swings.
Here, after breaking out the level there must be some sustaining candles formed to make a position in the market. Or, if the candles sustain over the level, it can turn into a reversal point.
The market follows an integrated psychology of traders,brokers,makers,takers.Therefore,we must wait for some sustaining candles and the candles must retrace the level for a continuation or reversal of the trend.
-Asif Hassan Risan
7 september,2024

BNB/USDT Chart Update!!Analysis: BNB/USDT continues to trade within a well-defined descending channel on the 2-hour timeframe. The price has recently bounced off a significant support zone around $498 - $505, suggesting buyers are stepping in at these levels. The bounce is taking place from the lower boundary of the channel, and there is potential for a move towards the upper trendline if buying pressure persists.
Disclaimer: This is not financial advice. Stay updated with market movements and adjust your trading strategy accordingly. Keep an eye out for further updates and analysis. Thank you!

BNB crash In the analysis you see (which is more or less the same for most altcoins)
We expect a correction to the specified range
The correction is definite and now it is not a suitable range for buying
Capital management is the only way to save you in this market

BNB Head-and-Shoulders: Short-Term Dip, Major Rebound PotentialBNB 1 day chart
The chart shows a head-and-shoulders pattern, signaling a potential short-term dip in BNB's price, likely towards the $320-$360 range, a strong rebound could follow, pushing the price upwards.

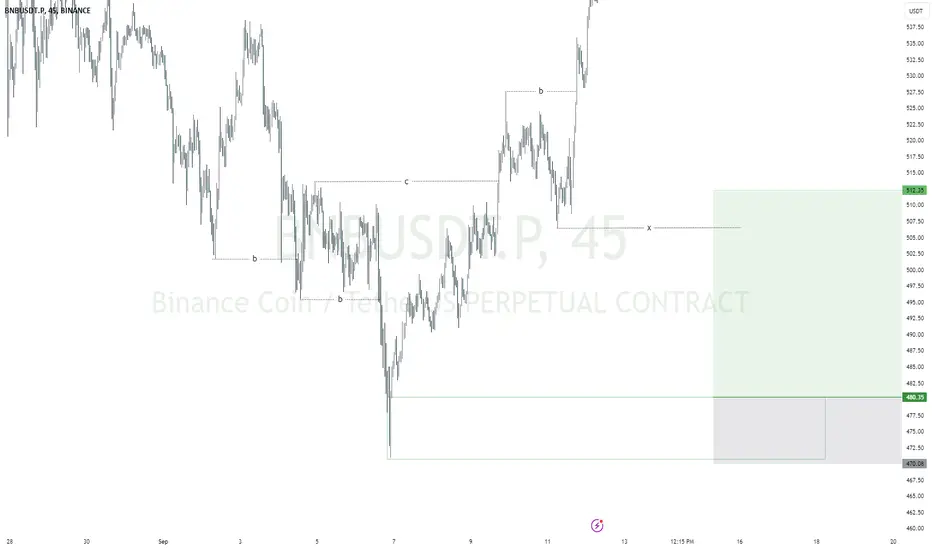
BNB: Strong Support Near $500 Could Trigger Bullish TrendBNB: Strong Support Near $500 Could Trigger Bullish Trend
BNB has tested a robust support zone around $500, showing a quick price reaction.
This area has seen multiple rejections, increasing the likelihood of a bullish movement.
The first resistance zone is near $512.
A decisive move above this level could enhance bullish momentum, potentially pushing the price up to $520 initially.
Further movements will depend on subsequent market conditions.
You may find more details in the chart!
Thank you and Good Luck!
❤️PS: Please support with a like or comment if you find this analysis useful for your trading day❤️
