Will BNBUSDT Crash Through Support? Key Levels You Can't Miss!Yello, Paradisers! Have you been keeping an eye on Binance Coin (#BNB)? Our latest analysis suggests a critical moment is approaching. Let’s dive into the details.
💎#BNBUSDT has been trading within a symmetrical triangle pattern on the 1D timeframe. Previously, We've observed a failed breakout which reinforces a bearish bias. Currently, #BinanceCoin is retesting the symmetrical triangle's lower support level, and there is a possibility that it might drop further.
💎The diminishing trading volume and POC of VRVP acting as resistance increases the chances of further drop. If #BNB fails to hold the support at the symmetrical triangle's lower boundary, it's likely to retest the Bullish Order Block (OB) around $460.3.
💎However, if CRYPTOCAP:BNB fails to hold at $460.3, the next support level to watch is at $422.9. This area is packed with liquidity and can create a good chance of pullback if tested.
💎On the contrary, If the symmetrical triangle's lower support level holds well, we could see the bulls taking control, leading to a bullish rally. The overall market sentiment and Bitcoin's movement will significantly influence #BNB's price action, so keep a close eye on these factors.
If you want to be consistently profitable, you need to be extremely patient and always wait for high-probability trading opportunities.
MyCryptoParadise
iFeel the success🌴
BNBUSDT trade ideas

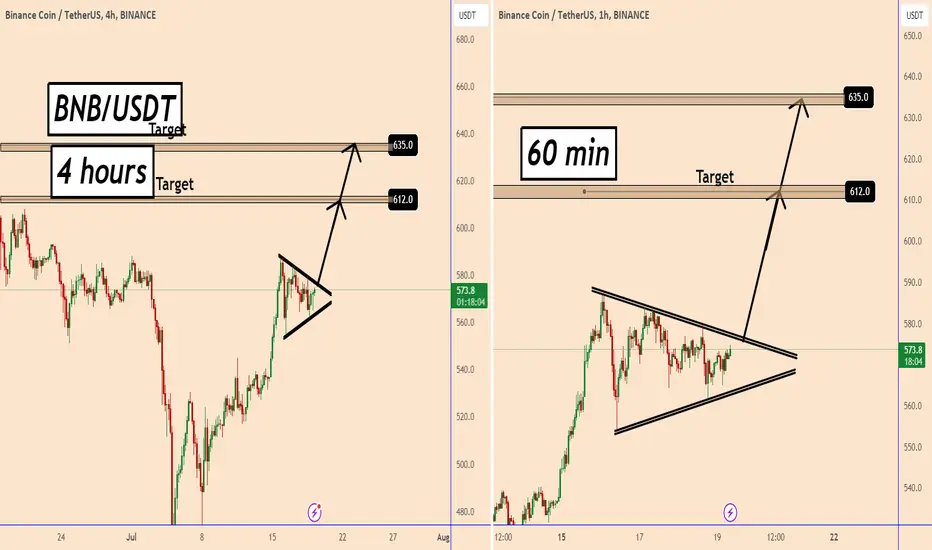
BNB Consolidating Inside a Triangle Patter, Bulls in ControlBNB Consolidating Inside a Triangle Patter, Bulls in Control
Price Analysis:
The price is developing a triangle pattern which is showing the possibility for a bigger bullish movement.
In the 4-hour chart the price faces a strong resistance near 590 but after this bullish accumulation, we should see BNB resuming the bullish trend again.
For this reason, we have to wait for the price to break out of the triangle shown on the 60 min chart.
BNB may rise to 612 and 635 after the bullish breakout.
You may find more details in the chart!
Thank you and Good Luck!
❤️PS: Please support with a like or comment if you find this analysis useful for your trading day❤️
BNB local longPotential accumulation range with a spring, so there is a probability to see price higher at the range high
BNB/USDT 1D Long TimeBNB is fighting to break out of the falling channel on top, it is currently struggling with the upper limit of a specific channel, as you can see, breaking out of the downtrend line with the top gave a strong upward signal.
Resistance lines are visible just above the upper border of the downtrend channel, while the next significant resistance levels are $666 and $724.
However, if the price is rejected and we experience declines again, we can see the first support zone from $564 to $544, then we have support at $509, and then the second very strong zone from $486 to $454.

BNBUSDT Buy SetupBinance coin Buy setup. We see triangle pattern on this chart, Bullish breakout is still active. 608 level is the target of this pattern. Risk reward 1:1.6

spotIn the crypto market, after each liquidity and receiving it
Spot buying becomes very important. You can buy in two stages of the current price and in the specified prices

BNB Shorting The Pullback IdeaHi Guys, this is a new setup, price already hitting a well respected supply zone, this mean there is two scenario, price is respecting and will go down or the price will be go trough, based on my analys there been an agressive selling in this zone and slower buyer, this is make perfect sense to be a pullback zone, so can short this one than go long when hitting the low. Please remember to only trade 1-5% of your capital per trade

BNB Speculation, Downtrend, Short trade after alertNow BNB between 580 and 554 Res level and lower POC.
The last time it fell about 35%. About 23% arose,
The price is lower than POC. In order to open a trade, you need to wait until Iseis is Res level.
If it rises, then I put an alert about 620 that Short.

BNBUSDT ShortBNB sell signal, Price is in strong Daily Supply zone , now we can see bears power to retest demand zone at 545 level. Risk reward 1:4

BNB-USDT Resistance BreakoutBNB-USDT Resistance Breakout
T1 - $2200 (Time Frame - 3 to 6 months)
T2 - $12200 (Time Frame - 6 to 18 months)
Condition - If breakout happens at key resistance level

BNB Eyes Bullish Breakout: Price Attempts Upward TrajectoryThe price of Binance Coin (BNB) is currently exhibiting interesting technical signals on the 4-hour chart, hinting at a potential bullish breakout. This analysis delves into the current price action, focusing on the 100-day Simple Moving Average (SMA) and the established bullish trendline, to gauge BNB's future trajectory.
100-Day SMA: A Benchmark for Momentum
The 100-day SMA acts as a crucial indicator of long-term momentum in the market. It represents the average closing price of BNB over the past 100 days, smoothing out short-term price fluctuations and revealing the underlying trend. Currently, the price of BNB is trading above the 100-day SMA, signifying a potential shift towards a bullish uptrend.
This position above the 100-day SMA suggests that the overall buying pressure for BNB is outweighing the selling pressure. Traditionally, a sustained move above this key moving average is often interpreted as a bullish signal, indicating that the long-term trend for BNB may be positive.
Bullish Trendline: A Guide for Direction
The 4-hour chart also reveals the presence of a bullish trendline. This line is formed by connecting a series of higher swing lows on the price chart, highlighting the overall uptrend direction. In an ideal scenario, the price should respect this trendline by finding support at its touchpoints.
The analysis points out that BNB has previously attempted to break above this bullish trendline, but faced selling pressure that resulted in a pullback. However, the recent price action suggests a renewed attempt to reclaim this uptrend. This retest of the trendline is a critical juncture, as a successful breakout could signal a continuation of the bullish momentum.
The Importance of Confirmation
While the current technical indicators are promising, it's crucial to emphasize the importance of confirmation before drawing definitive conclusions. Here's how confirmation can be established:
• Volume: A surge in trading volume alongside the breakout from the trendline would provide stronger validation of the bullish move. Higher volume suggests increased participation from buyers, reinforcing the uptrend.
• Technical Indicators: The convergence of other technical indicators, such as the Relative Strength Index (RSI) or the Moving Average Convergence Divergence (MACD), with the bullish signals on the chart can bolster confidence in the breakout.
Looking Ahead
The confluence of the price trading above the 100-day SMA and the retest of the bullish trendline paints a potentially optimistic picture for BNB. If confirmed by increased volume and supportive technical indicators, this could lead to a sustained price increase in the coming weeks.
However, it's important to acknowledge that the cryptocurrency market remains volatile, and unforeseen events can trigger price reversals. Continuing to monitor market developments and incorporating additional technical analysis is essential for making informed investment decisions.

Binance Coin (BNB): Looking For Rejection From ResistanceBinance Coin has been having a nice rally to upper zones, claiming unfilled FVGs that formed when we had a nice dump on the coin.
As of now, we are testing the 200EMA and approaching the upper resistance zone in 4-hour timeframe so this is the zone we will be looking for some weakness to kick in. It is still early to talk about it so let's wait for the zone to be reached and then look closer to the situation!
Swallow Team

BNBUSDT Path to $2500BNBUSDT Technical analysis update
BNB price has been trading inside a range for the last 1,230 days, with multiple rejections from the resistance of the range. Now, the price is moving towards a breakout, which could happen in 1-2 months. The price could reach the $2,000-$2,500 level in 2025.
HODL.

BNBUSDT.Pin short term i am looking for sell position and after that ii expect price pushes upside until 4H OB

BNB/USDT TO $740 BUY NOW!!!!!!!!!BNB took out the buyside liquidity and price made a possible increase and showing a strong uptrend pattern following the falling wedge breakouts and retest am goin on buys from this zone with tp $740
JOIN AND ENJOY
Tell us your views..........

BNBUSDTmy entry on this trade idea is taken from a point of interest below an inducement.. I extended my stoploss area to cover for the whole swing as price can target the liquidity there before going as i anticipate.. just a trade idea, not financial advise

Ichimoku Signals Bullish Continuation for Asset: $BNBUtilizing Ichimoku analysis, I suggest waiting for confirmation of a Bullish Continuation at 545.1, with a subsequent price projection of 595.2.
Please note that this analysis is not a recommendation to buy, but rather a tool to assist you in your own research and decision-making process.

BNB/USDT.P 1Day TimeframeLong Idea for BNB. Completion of Bullish Cypher Pattern in D leg at around 365. TYOR DYOR

Swing trade low risk high reward entrys and exits "Waterfall "Low Risk High Reward/ High Probability Play. My Own Customized coded indicator. Enter take profit, then enter again the take profit ... moving stop loss along the way.
"Waterfall Reversal"
50%- 100% + profit moves, with 5%-10% risk.
Were patience and stop losses pay off.

Leg Down To The 400$ Area Then New Bullish Move Toward a New ATH👉 Easy And Simple Setup ,There Is a Perfect Horizontal Channel Formed At The Chart And Recently The Price Rejected From The 700$ Top ,I Expect a Leg Down Toward a 400$ Area As a Final Down Before Breakout The Channel Toward a New ATH

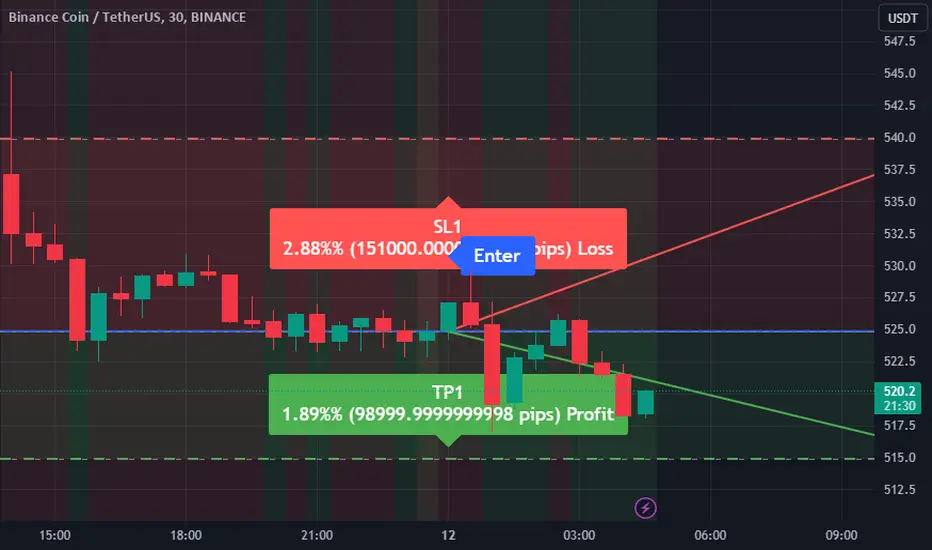
Trading Signal Alert: BNBUSDTAttention Traders,
We have a new signal for BNBUSDT based on our technical analysis and the EASY Quantum Ai strategy.
Direction: Sell
Enter Price: 524.8
Take Profit: 514.9
Stop Loss: 539.9
Justification for the Signal:
1. Market Trend: Our analysis using the EASY Quantum Ai strategy indicates a downward trend for the BNBUSDT pair. Recent price action suggests bearish momentum.
2. Technical Indicators: Key indicators such as the Moving Average Convergence Divergence (MACD) and Relative Strength Index (RSI) are signaling bearishness. The MACD line is below the signal line, and the RSI is below the mid-point of 50, indicating selling pressure.
3. Support and Resistance Levels: The current price level is testing lower support. Breaking below the 524.8 mark will likely drive the price towards our Take Profit at 514.9. Conversely, our Stop Loss at 539.9 will safeguard against unexpected volatility.
Remember, always apply proper risk management and trade responsibly.
Best of luck and happy trading!
EASY Quantum Ai Team
Crypto Market Weekly Analysis: BTC, ETH, SOL, BNB, BTC dominanceWelcome to our weekly analysis of the cryptocurrency space.
█ BTC/USDT
The BTCUSDT chart shows Bitcoin trading within a descending channel, with recent price action bouncing off the lower boundary of this channel, indicating potential support around the $53,000 level. The RSI indicates bullish divergence, suggesting a possible trend reversal or a strong bounce from this support level. Additionally, the Volume Profile on the right shows significant trading activity between $68,000 and $60,000, indicating key resistance levels above.
█ BTC.D
The Bitcoin dominance chart shows Bitcoin dominance forming a rising wedge pattern, which typically indicates a potential bearish reversal. The RSI is exhibiting a bearish divergence, suggesting weakening momentum and a possible decline in dominance. A breakdown from the wedge could target a significant decrease, aligning with the projected target area shown on the chart.
█ ETH/USDT
The ETHUSDT chart shows Ethereum trading within a descending channel, with recent price action rebounding off the lower boundary, suggesting potential support around the $1,850 level. The RSI is showing signs of a potential bullish divergence, indicating a possible trend reversal or a strong bounce from this support. The Volume Profile indicates significant trading activity between $3,200 and $3,600, suggesting key resistance levels above.
█ ETH/BTC
The ETH/BTC chart suggests upward action for the RSI and bullish patterns with a primary target of 0.06178 BTC and a secondary target at 0.06861 BTC. This follows the Bitcoin dominance bearish sentiment meaning more capital would flow into altcoins and Ethereum being their catalyst.
█ NASDAQ
Bitcoin has often been correlated to stocks , not that it's a good thing, however since Bitcoin's ATH in march we've seen stocks keep rising while Bitcoin ranging with around 30% downside from ATH. Nasdaq is at ATH right now and Bitcoin is not. The RSI suggests that stocks are overbought but not indicating a divergence yet.
█ BNB/USDT
The Binance coin is currently down 28% from its ATH after bouncing up +10% from its middle point of 450 $. I'm still bullish as long as the shift to altcoins scenario continues and RSI remains in the bullish area above 50.
█ SOL/USDT
Solana shows a bullish wedge and multiple bottoms of its 3 months support at 127 $. RSI is printing a bullish divergence. My primary target is 189 $ and 2nd is 210 $.
█ GAMING coins
EGLD has been outperforming Bitcoin and is the top performing gaming coin of the week.
█ Top cap coins
The biggest coins in market cap compared to Bitcoin shows Solana in first and AVAX in second.
█ AI coins
Artificial Intelligence coins compared to Bitcoin: INJ arrives first and NEAR second, but the global AI space isn't performing remarkably well.
█ MEME coins
Ending this analysis with meme coins , we can't ignore the fact that BONK is hard outperforming Bitcoin in first position.
Thanks for reading until here, I hope I can catch the time to make another analysis next week.
